School Grants
Burbio School Tracker 2/05: Deadlines
This week we look at the role that deadlines play in state-sevel funding grants, plus take a look at unspent ESSER III funds in districts across 23...
This week we look at 2024-25 budgets for some districts that received the most dollars-per-student of soon-to-be-expiring federal aid. We also look at California's district-level ESSER III spending, and map the percentage of K-12 school district revenue from local sources across the country. More below.
1. In our March 19th Tracker we ranked large districts by the amount of ESSER III funding-per-student the district received as we looked at districts that would face the largest budget transitions when stimulus funding expires. This week we look at 2024-25 published budgets for districts from that list that were among the top 20 in the country.
Boston Public Schools, MA, which has seen an enrollment decline of 9.3% since 2019/20, and received over $275 million of ESSER III funding describes in their 2024-25 budget the following:
The School District of Philadelphia, PA recently adopted a budget including:
Baltimore City Schools approved a budget that features:
Other districts from the list include:
Dayton Public Schools, OH reviewed next year's budget and projections at their May board meeting, which includes a 15% increase in expenditures versus 2023-24.
Hartford Public Schools, CT, passed a budget that called for a $42 million decrease in expenditures - an 8% cut - amid public reports of a reduction of over 300 staff. In the last few weeks $10 million in additional funding has been offered by state and city sources to mitigate some of the terminations.
Indianapolis Public Schools, IN, adopted a budget that increases spending by 2.2%, to $456 million. Indianapolis's enrollment has been flat to up slightly the last three years amidst a large shift to charter schools within the district.
Providence Public Schools, RI, reports a flat $428 million 2024-25 budget, including a $17 million decrease in salaries, retirement and medical expenses.
Syracuse City School District, NY has a budget of $578 million, a 10% increase on 2023/24, and an increase of 20.1% since 2022/23.
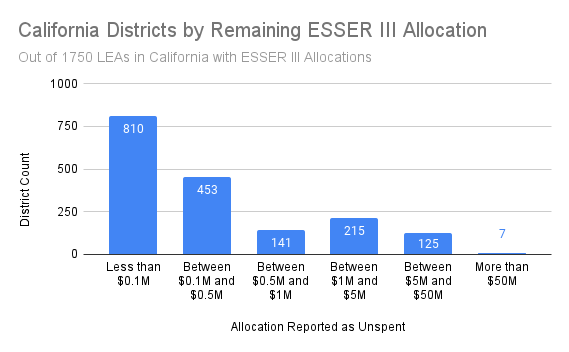
2. Burbio tracks ESSER III spending by districts nationally and this week we profile the most recent reporting from California.
The chart below breaks down the number of districts and the amount they have remaining:
Below is a breakout by decile of percent of allocation that has been spent:

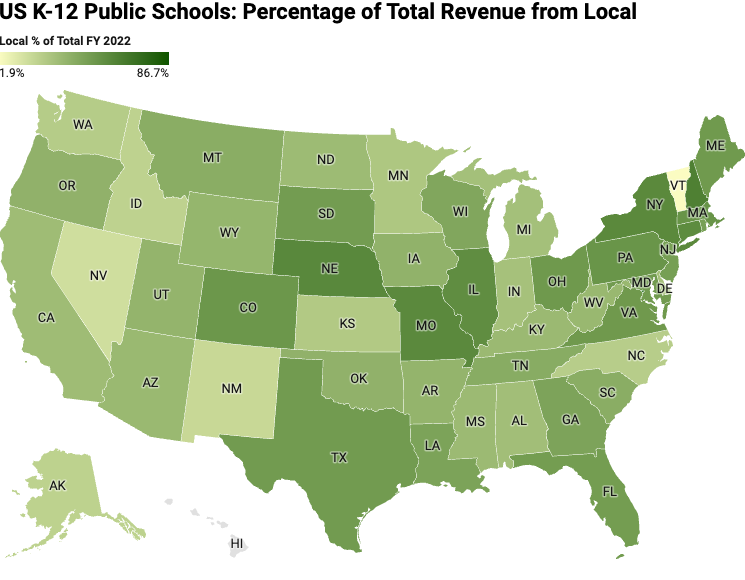
3. NCES recently released their report titled "Revenues and Expenditures for Public Elementary and Secondary Education: School Year 2021–22." Below is a map that indicates the percentage of state K-12 district budget revenue that comes from local sources. The darker the green the higher the percentage. Note that the Northeast and Midwest have the highest percentage of revenue from local sources. New Hampshire (61.7%), Nebraska (57.6%) and New York (57%) represent the highest percentages, while Vermont (1.9%), Nevada (15.4%), New Mexico (18%) and Idaho (21.1%) represent the lowest percentages. A rollover version of this map can be found here.
This week we look at the role that deadlines play in state-sevel funding grants, plus take a look at unspent ESSER III funds in districts across 23...
This week we break down the K-12 state grant market by category, review regional differences in key board meeting discussions, and map the percent of...
This week we look at Superintendent turnover percentages in some large states, profile grants with impending deadlines for the 2024-25 year, and...