School Grants
Burbio School Tracker 3/05: Endgame
This week we break down the cohort of districts with the most available ESSER III funding heading into the 2024-25 budget year, chart trends from...
This week we break down the K-12 state grant market by category, review regional differences in key board meeting discussions, and map the percent of money each state contributes to K-12 district education budgets.
1. Burbio's State-Level Funding Tracker features state-specific grants for K-12 schools, covering all state departments, as well as Federal grants where states can tailor the criteria. Burbio has identified over 1,000 grants, and the database is growing daily. Given the expiration of ESSER III funding during the 2024/25 budget year, these state-level grants will increase in importance in the funding landscape.
This week we illustrate the scope of funding involved. Below is a chart that summaries 25 categories of grants, the number of grants for each category, and the market size for the categories involved. There are some important points of explanation to interpret the data:
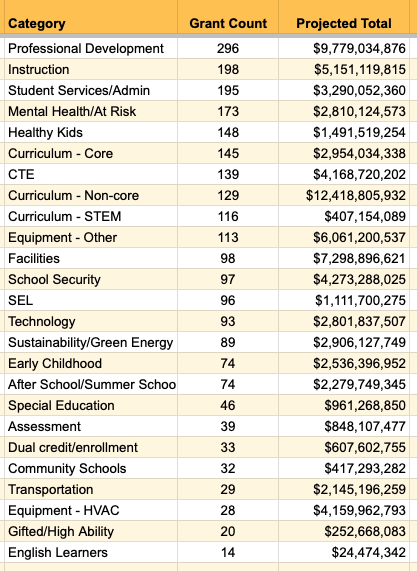
At Burbio we have specialized in categorizing highly fragmented, unstructured K-12 datasets as shown in our work tabulating over $90 billion of ESSER III spending plans. We find state grant applications and criteria to be written clearly, but they can be broad, so we always encourage our clients to evaluate adjacent or related categories for opportunities. A good example from above is in the STEM category; we have identified grants that specifically call out STEM and categorized them as such, but there are more general curriculum and instruction grants that might apply to STEM as well.
The database also includes factors such as the application deadline, district eligibility, districts who have been awarded funding (if available), funding totals, and more, and features an email alert system when new opportunities are identified.
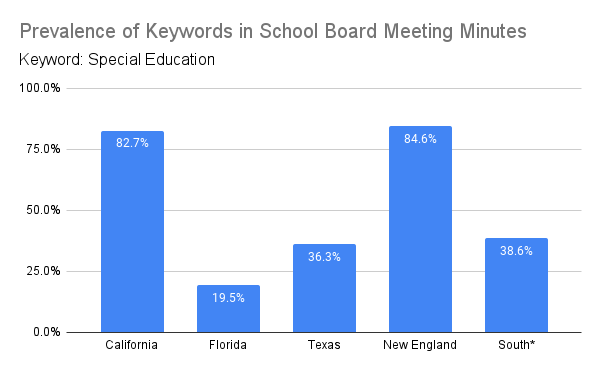
2. Burbio's School Board Meeting Tracker covers school board meetings for just under 2,000 school districts each month, representing over 50% of the K-12 school population. This week we dive deeper into how district priorities and terminology differs across different regions.
In the charts below there are five geographies featured: California, Florida, and Texas, plus a bundling of New England states (CT, MA, VT, NH, RI, ME), and southern states (AL, MS, NC, TN, SC). Districts surveyed cover well over half the K-12 population in each geography, with the exception of New England, where the reporting covers just under half. The charts below present the percentage of districts that mentioned the terms at least once since January 2024.
The first chart shows district mentions of STEM (we also searched for STEAM). Florida school boards mentioned these terms the most frequently: 
The next chart covers a basket of terms related to Special Education. The terms are particularly widely used in California and New England:
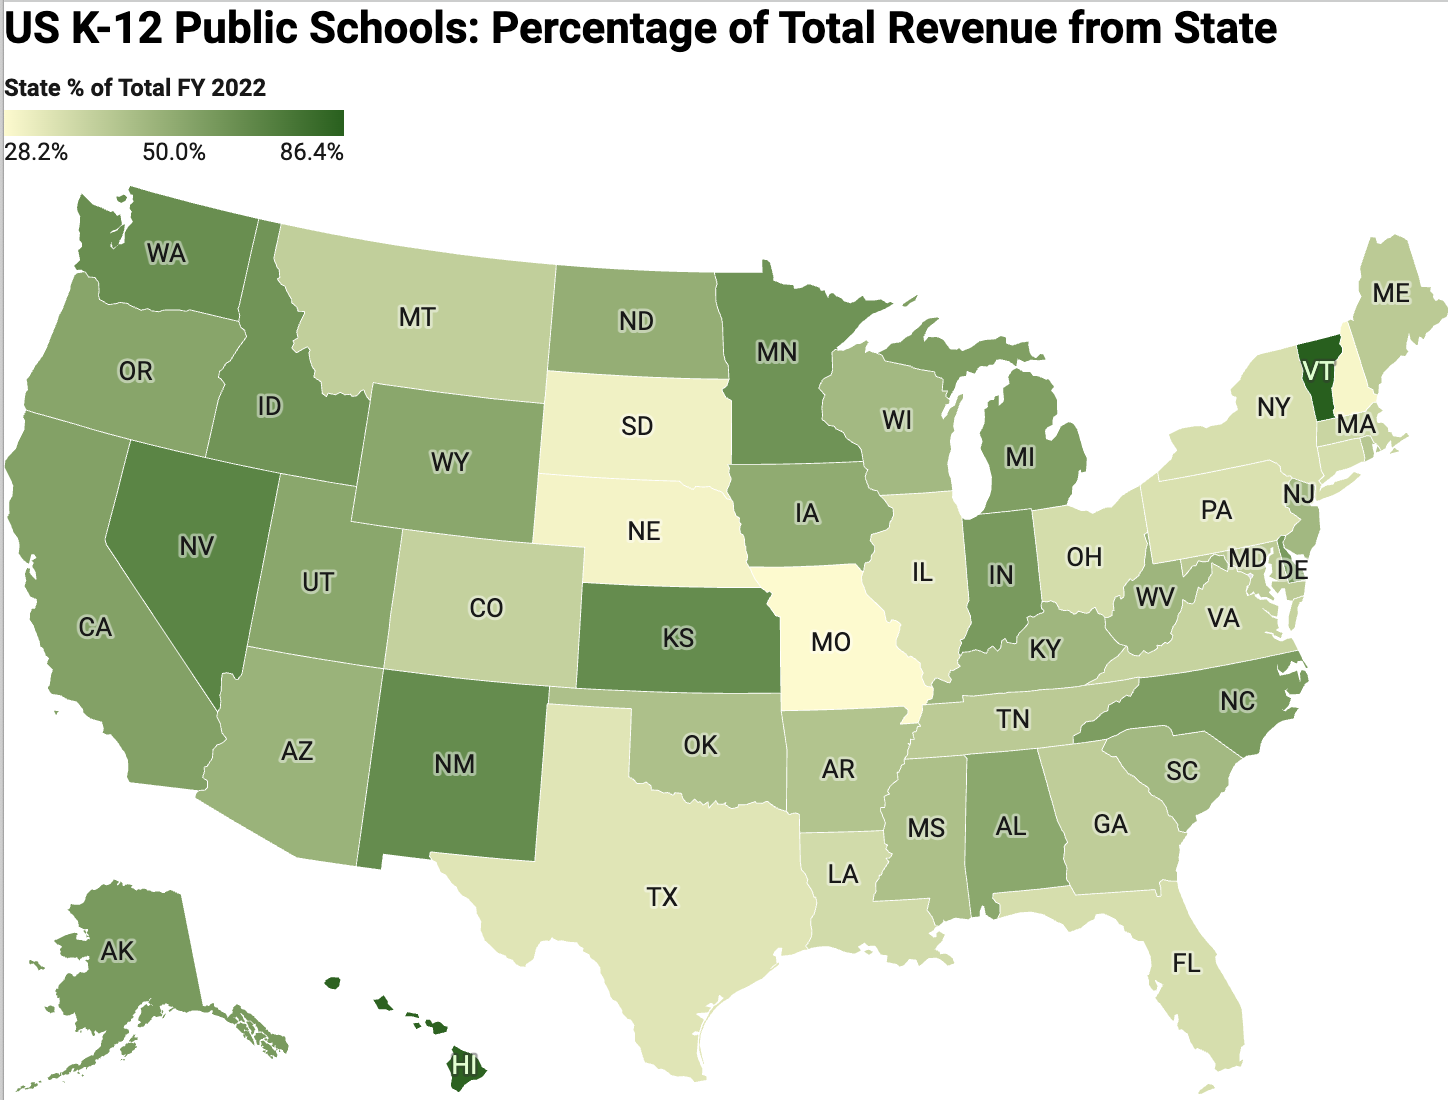
3. NCES recently released their report titled "Revenues and Expenditures for Public Elementary and Secondary Education: School Year 2021–22". Below is a map that indicates the percentage of state K-12 district budget revenue that comes from state sources. The darker the green the higher the percentage. Vermont (86%), Nevada (68.4%), and New Mexico and Kansas (both 64.9%) represent the highest percentages, while Missouri (28.2%), New Hampshire (29.4%) and Nebraska (30%) represent the lowest percentages. A rollover version of this map can be found here.
This week we break down the cohort of districts with the most available ESSER III funding heading into the 2024-25 budget year, chart trends from...
This week we add more states to our overview of K-12 enrollment trends between the 2020/21 and 2021/22 academic years. Mask policy changes have...
In this week's Tracker we cover trends in Superintendent Turnover, the frequency of mental health discussions in K-12 strategic plans, state-level...