PreK-12
Burbio School Tracker 7/29: AI's Early Days
With recent activity at the Federal level, this week we review district-level AI initiatives from California, discussions in board meetings related...
This week we compare pre- and post-Covid student enrollments for districts that received the most ESSER III dollars per student, the state-level landscape for STEM grants, and a tool that allows for a customized look at district-level priorities.
1. In our previous Tracker we highlighted the fact that billions of dollars of ESSER III spending will be committed and spent during the 2024-25 budget cycle. Even as federal stimulus spending winds down, the amount of funding remaining is material by any historical standard.
This week we review enrollment trends in districts that received the most dollars per student in the ESSER III spending package. State funding formulas generally take enrollment into their calculations, and districts that have received the highest apportionment of per-student revenue face the biggest budgetary transition, which can be compounded by enrollment declines.
For this analysis we ranked districts with more than 10,000 students by the amount of ESSER III funding per student the district received. The chart below shows the 20 districts with the largest allocations. Other columns lay out the 2022-23 enrollment according to NCES, and the two columns on the right show the enrollment change in 2022-23 versus 2021-22, and then 2022-23 versus 2019-20, which was the year before Covid-19. To note:
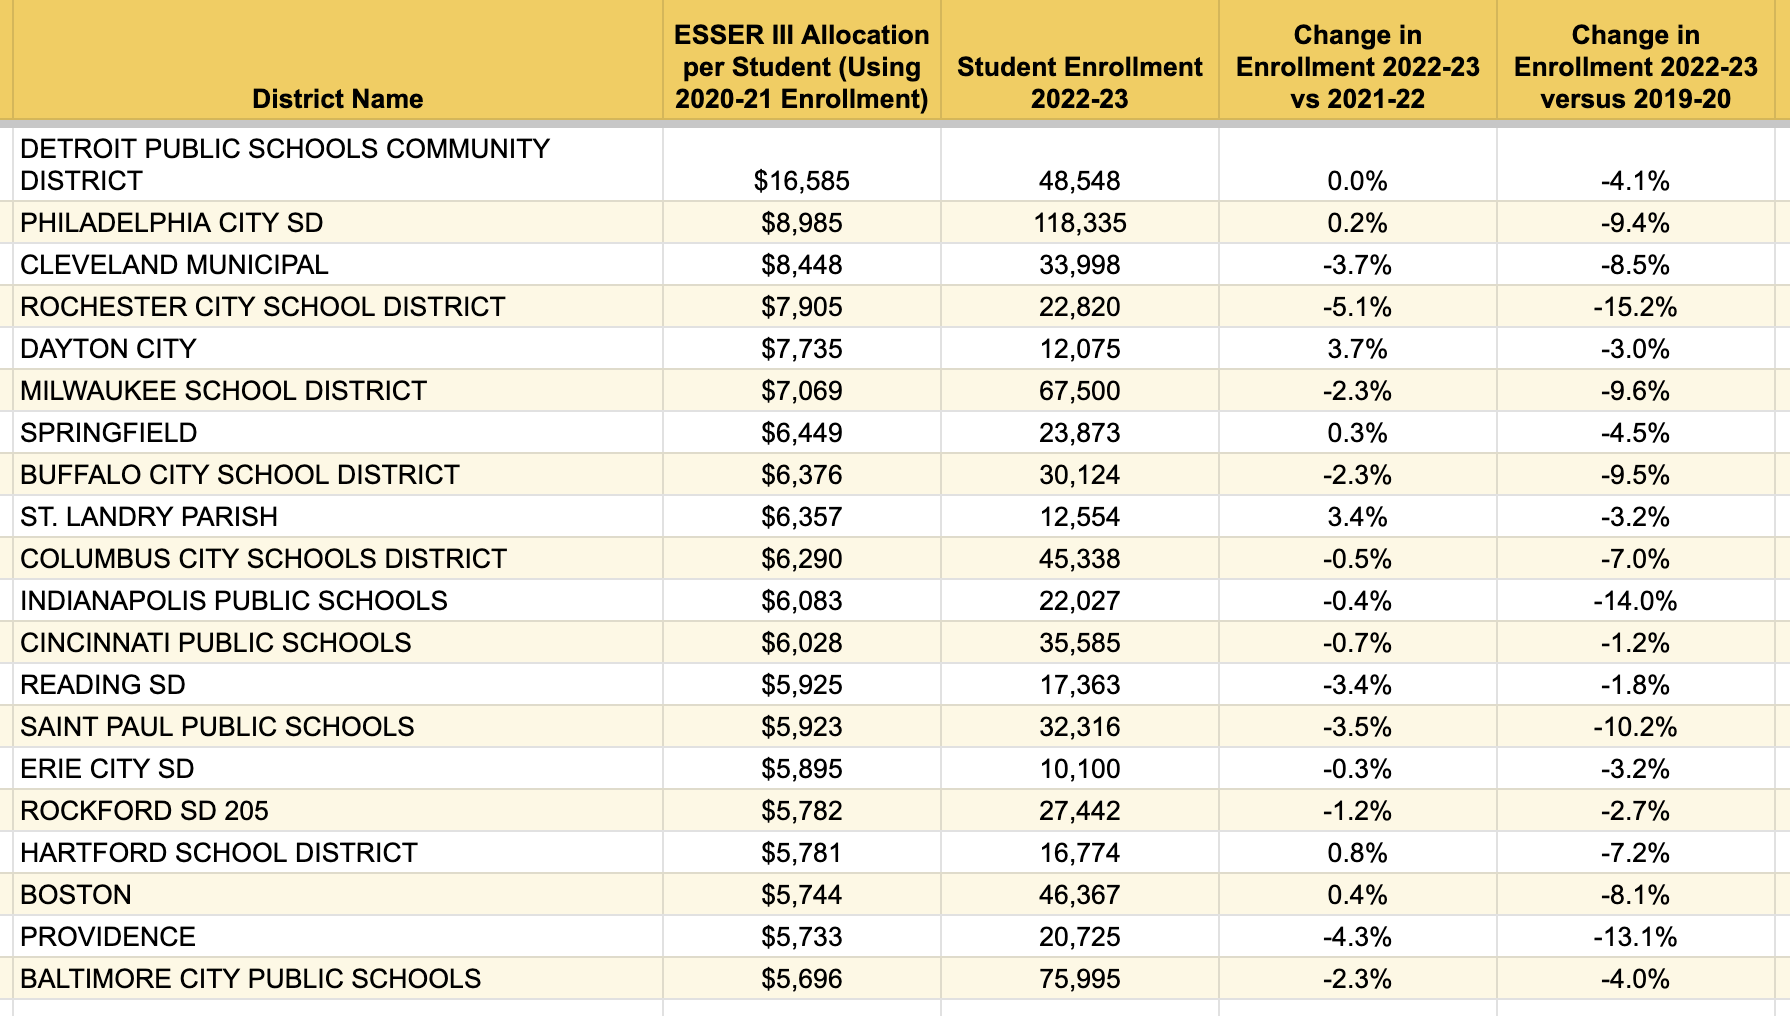
At the bottom of this blog we show an additional chart with districts 21-50 in the rankings, including New York, Los Angeles, and Chicago.
2. Burbio's State-Level Funding Tracker features state-specific grants to K-12 schools, covering all state departments, in addition to Federal grants where states can tailor the criteria. As Covid-era federal K-12 support expires, discussions around incremental funding will increasingly turn to the state level. Burbio has currently identified over 800 grants and the database is growing daily.
One of the larger categories is STEM, where we have identified over 80 grants across 40 states plus the District of Columbia. STEM grants cover everything from curriculum and equipment purchases to teacher training and program design. Some examples from around the country:
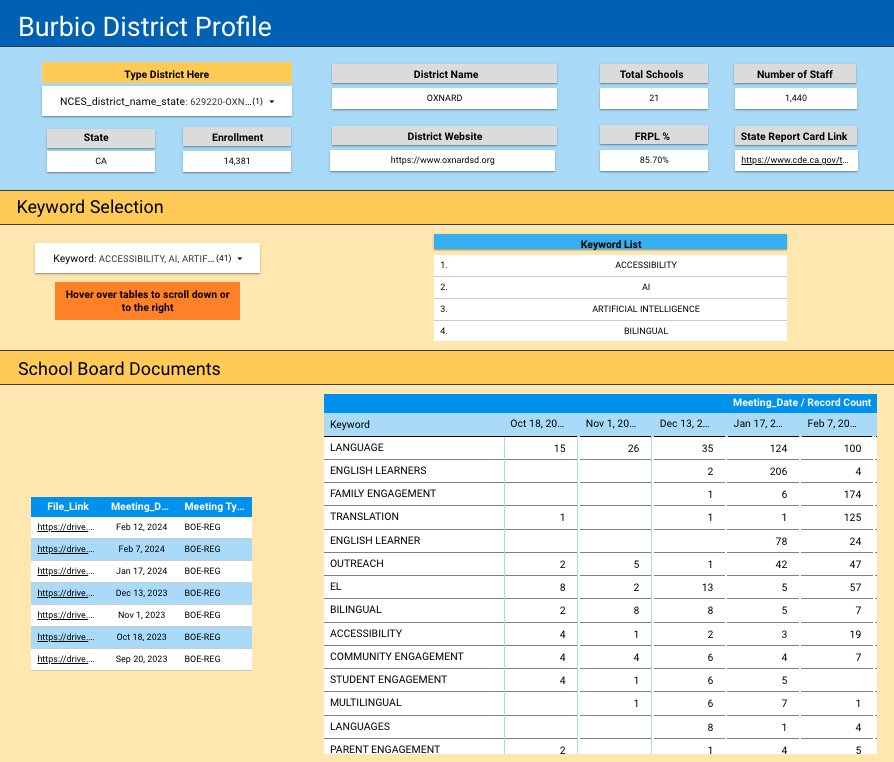
3. Burbio's business intelligence platform includes insights from school board meeting minutes, strategic plans, ESSER III, state-level funding, and more. One of our platform tools is a "District Profile" with each districts' information in one "view." Clients can add dozens of data points per district to their CRM merely by adding one field and importing the relevant links. This sales enablement tool saves research time for account teams and allows for more focused customer discussions.
We are adding a new feature that calls up client-specific keywords for each profile. Below is an example of Oxnard School District, CA customized for a company that provides ELL services. Note the high number of references in the January and February board meetings to topics such as translation, English Learner, and family engagement:
A similar analysis is presented for district strategic plans and LCAPs. Keywords are customized for each partner based on the segment of the K-12 industry they work in. In addition to corporate clients, the service can be used by advocacy groups and policy makers to identify district priorities.
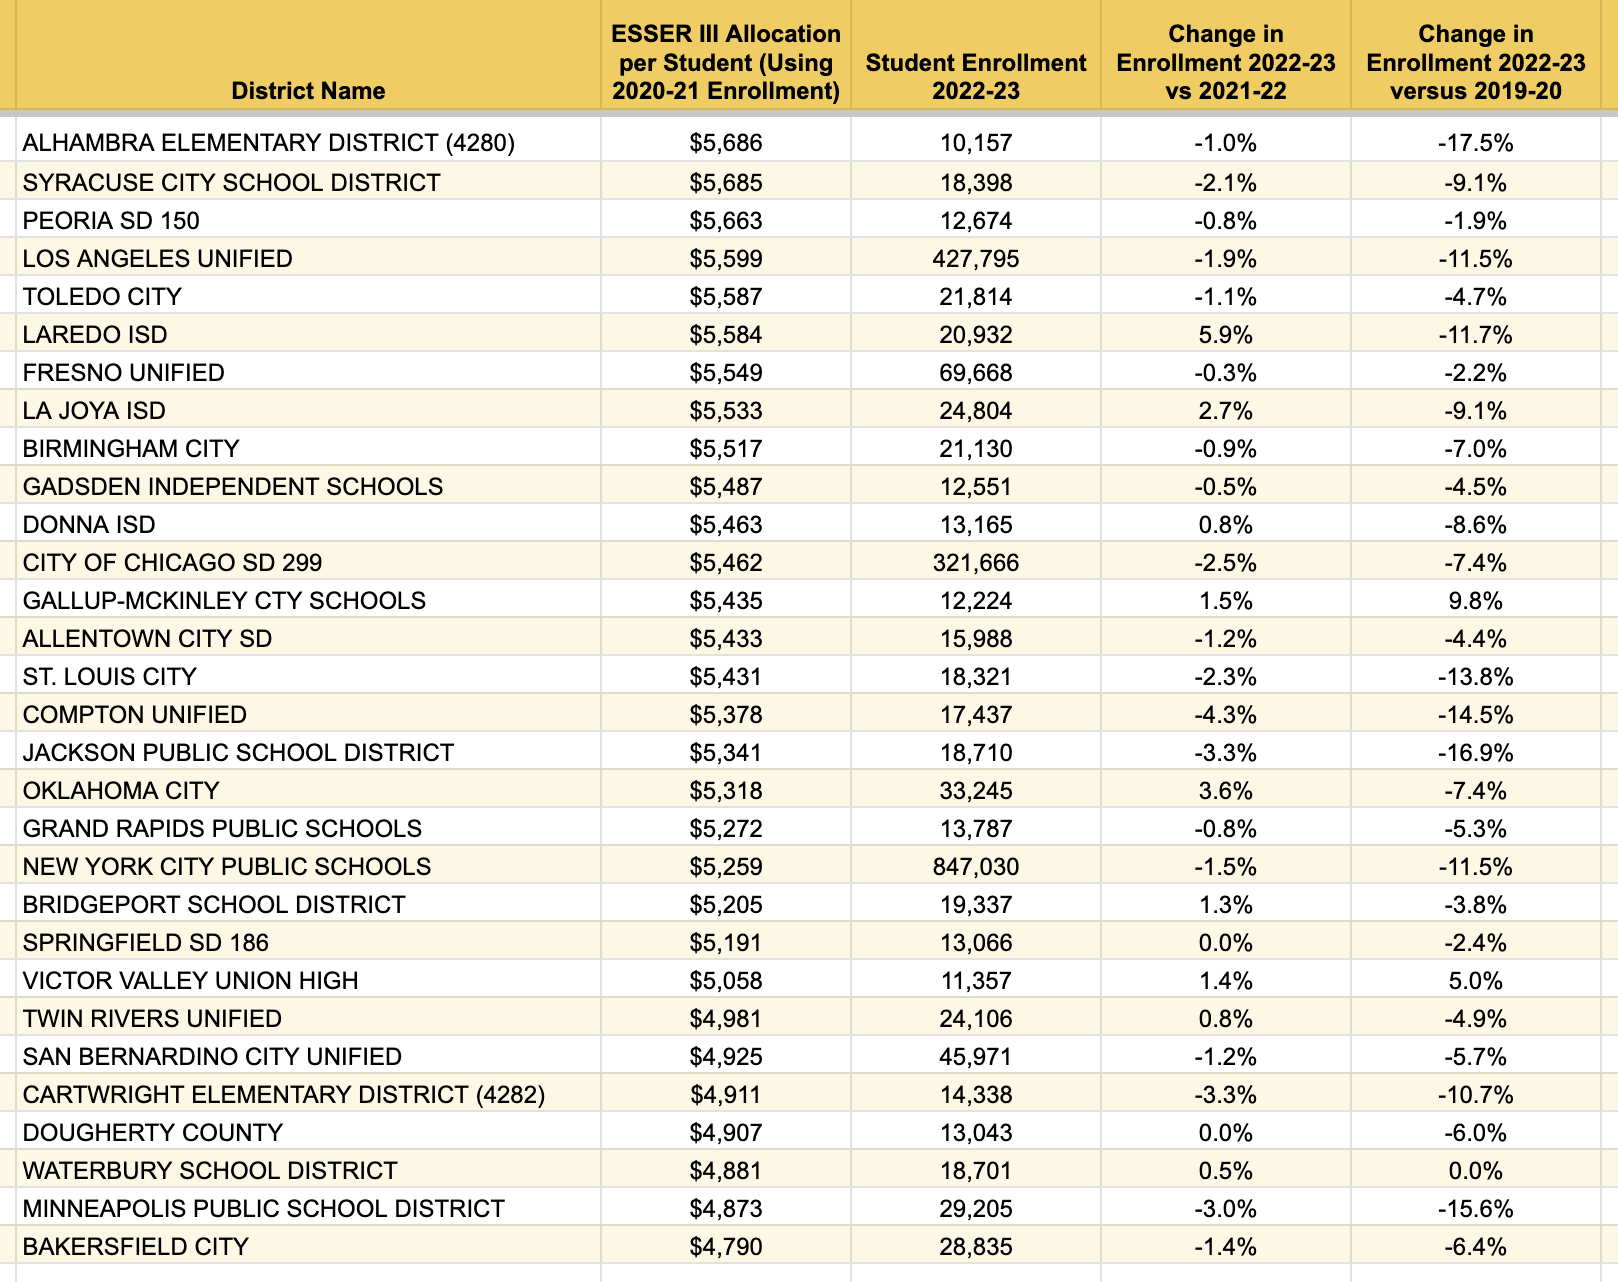
4. Below we expand the above analysis of enrollment trends in districts with a high proportion of ESSER III allocations. The chart features districts 21-50 in the ranking. A few notes:
With recent activity at the Federal level, this week we review district-level AI initiatives from California, discussions in board meetings related...
This week we look at 2024-25 budgets for some districts that received the most dollars-per-student of soon-to-be-expiring federal aid. We also look...
This week we look at discussions about federal funding at the district level, districts discussing new curriculum adoption, districts rolling out...