1. Burbio's
School Budget Tracker documents detailed K-12 spending, and as part of that initiative we see discussion of district enrollments. This week we highlight districts where enrollment is declining. In a future blog post we will highlight districts where enrollment is increasing.
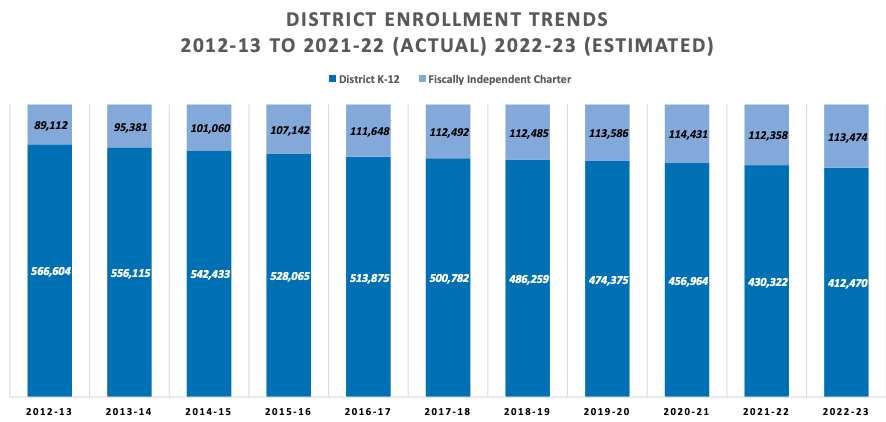
- Los Angeles Unified School District's budget documents show enrollment declines for the past in the chart below, inclusive of charter schools. The district is forecasting a 3% enrollment decline for 2022/23, which would be a 10.5% decline from the 2019-20 (pre-Covid) school year.
"Enrollment peaked in 2002‐03 at 746,831 and has declined each year since. This is due to several factors, including the reduced birth rate in Los Angeles County and the increasing cost of living in southern California," reads the budget document. "Declining enrollment affects both revenue and expenditures. However, declining enrollment typically causes a more rapid decline in revenue after the first year. This is because declining enrollment districts are essentially 'held harmless' for the decline from the previous year."
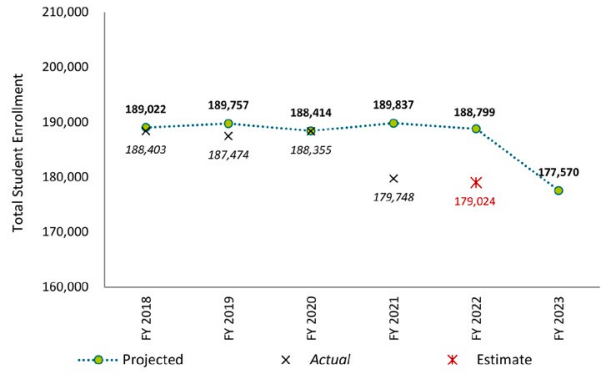
- Fairfax County Public Schools' enrollment was roughly flat from FY 2018 to 2020 and then dropped 4.5% in FY 21. Note the "X" represents the actual enrollment and the green dot represents what was projected. The district projects a slight decline of 0.8% this coming year.
"(Budget) savings from declining enrollment is $88.2 million," reads the document. ". . . .Enrollment projections reflect a larger cohort of students moving from middle school to high school and the impact the COVID-19 pandemic has had on public education enrollment across the country. The projected decrease of 11,229 students results in 917.7 fewer positions and savings in substitutes and logistics."
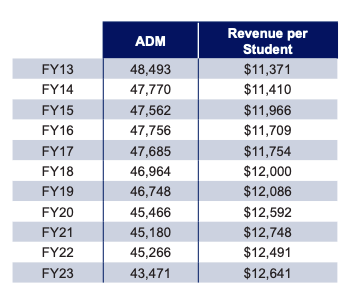
- Anchorage School District, AK has projected a decline of 4% in "Average Daily Membership" (ADM), the district's term for enrollment, for the FY 23 school year.
A note from the district Superintendent reads, "The (state) funding mechanism does not account for inflation, which is a real expense . . . . inflation has reduced purchasing power at a level of approximately $40 million less than what the District could afford in 2017 in real dollars. This, coupled with a declining student enrollment in our city, continues to negatively impact ASD’s ability to maintain smaller class sizes . . . ASD has been using federal, one-time funds to fill the gap and offset the deficit . . . ."
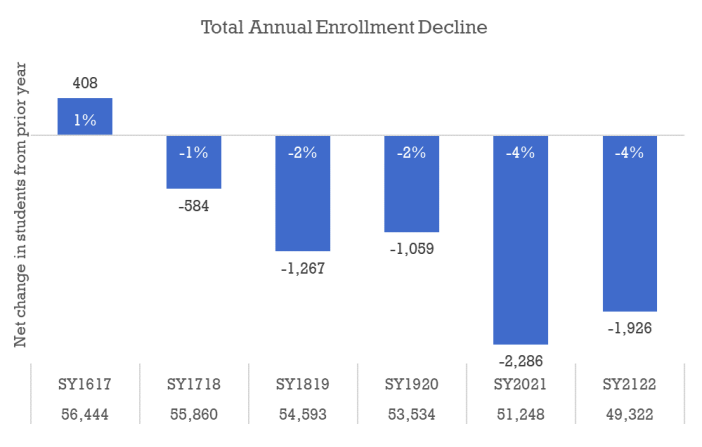
- Boston Public Schools, MA has experienced a 4% enrollment decline each of the past two years, and in a note next to the chart below observes, "We anticipate enrollment declines for FY 23."
"For the second year (we) are making major investments to maintain programming for students in all schools, especially those experiencing declining enrollment," notes the budget. "This investment will direct over $200 more per pupil to Black and Latinx students than to Asian and White students. Similarly it will direct almost $300 more per pupil to Low Income students than to Not Low Income Students."
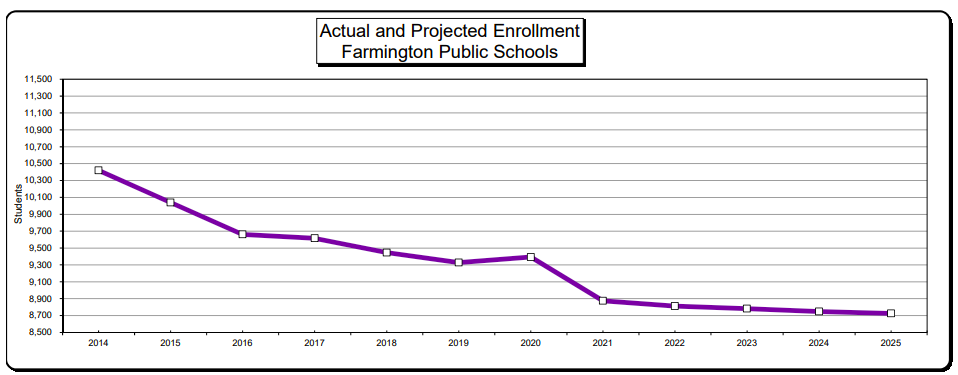
- Farmington Public Schools, MI has seen an enrollment drop of 6.2% since 2020, and 19% since 2013, and is projecting relatively flat enrollment this coming year.
"The pandemic has had an effect on enrollment, as many parents chose to leave for private or parochial schools or an alternate education option," reads the budget document. "The majority of the revenue decrease for the enrollment loss was reflected in the 2021/22 budget."
- From their district website, Albuquerque Public Schools, NM which had a 42.9% chronic absenteeism rate this past year (up from 16.3%, 15.7%, and 23.4% the previous three years), presents this easily toggled chart that outlines the district's declining enrollment. District enrollment has dropped every year since 2009/10, going from 92,123 to 73,346 during that period.
- Forest Grove School District, OR had an enrollment drop of 7.8% (5,828 to 5,385) from FY 2020 to 2022 and is projecting 5,294 in FY '23. "In the 2020-21 school year, the District lost 332 students primarily to other online learning opportunities," reads the budget document. "We anticipated recovering about half of those students in the 2021-22 school year. However, with additional COVID disruptions, enrollment was reduced by another 121 students. . . ."
2. Burbio's
School Opening Tracker launched in August 2020. During the 2020/21 academic year, Burbio measured learning "modalities" (whether a school district offered virtual, hybrid, or traditional in-person learning) on a weekly basis across 1,200 districts representing 47% of the US K-12 school population. This initiative offers a resource for examining K-12 education over the last two years (the dataset
expanded further during 2021/22). Below are some of the research papers that have used Burbio's school reopening data in their analysis:
- This study published in Nature Magazine in October 2021, conducted by a team led by Westyn Branch- Ellman, studied "The impact of school opening model on SARS-CoV-2 community incidence and mortality."
- This study, published in the CDC MMWR in July 2021 and conducted by a team led by Professor Emily Oster, studied "Disparities in Learning Mode Access Among K–12 Students During the COVID-19 Pandemic, by Race/Ethnicity, Geography, and Grade Level."
- This study from the Center for Education Policy Analysis, Stanford, conducted by a team led by Thomas Dee, studied the impact of school learning modalities on enrollment.
- A July 2021 study by the National Center for Research Education and Choice (REACH), based out of Tulane, and led by Douglas Harris, studied reopening patterns by districts during 2020/21 and looked at local demographics, health considerations, and politics.
- This December 2021 study by McKinsey & Company is titled "The Emerging K-Shaped Recovery" and studies the scope of unfinished learning outcomes across K-12 education.
-
Multiple papers have been published through the National Bureau of Economic Research (NBER).
This paper, issued by an international team of researchers studies the effects of school disruptions on economic and educational outcomes.
This NBER paper creates a report card for responses to Covid 19 across a number of factors, including school reopening policies.
This report studied Covid 19 and its impact on school bullying and cyberbullying.
The list above is just a representation of papers done to date, and there are multiple additional studies currently being conducted.