School Board Meetings
Week of 5/30: Protocols
This week we update our enrollment analysis with the addition of complete enrollment figures from Vermont, district-level information for Rhode...
This week we look at some examples of state-level ESSER III spending, district-level enrollment shifts from the latest NCES data, and the residual impact of last year's rise in kindergarten enrollment.
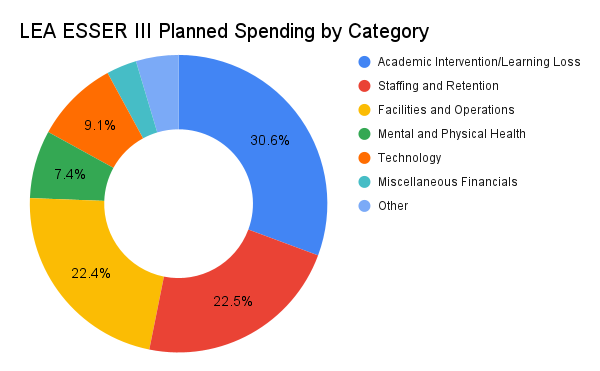
1. As we have noted, Burbio has analyzed and categorized over 6,000 ESSER III spending plans from across the US, with over $93 billion of planned spending. We are growing the database to 7,000 plans and tracking plan changes and spending rates.
In the majority of states, districts have flexibility in describing ESSER III plans. This approach makes plans easy to understand as they often get specific about resource allocation. We have broken down ESSER plan spending into over 100 spending categories for our partners to use. For almost all 100+ categories, it is straightforward to assign spending into a bucket for aggregate presentation (as illustrated below). For example, the "HVAC/Air Filtration" category goes in facilities, "Mobile Devices" in technology, "Afterschool" goes into academic intervention etc.
The tricky category is "Staffing." When districts indicate what staffing is for (e.g. "tutoring" or "mental health supports") we assign resources to that bucket. For much of staffing spending, however, districts do not indicate where staff is assigned (staffing can includes nurses, bus drivers, and more).
The implication of this is that in our aggregate presentations below, some of the resources indicated for "Staffing and Retention" are likely being used in other buckets, such as academic intervention or mental health, but we couldn't allocate due to lack of visibility. To review, this is the national breakout of funding;
 |
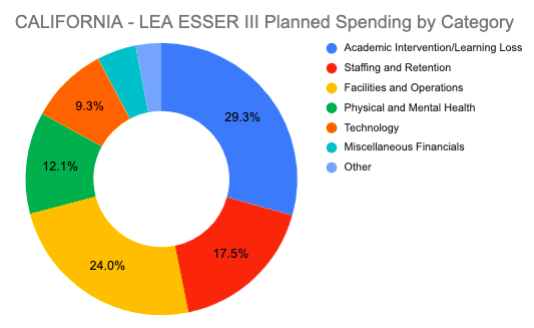
Below is the state of California's specific breakout. California has a slightly higher spend on Physical and Mental Health versus the national breakout, a lower spending total for Staffing, and a similar amount on Technology. California plans were particularly specific about staffing usage which made it easier to assign:
 |
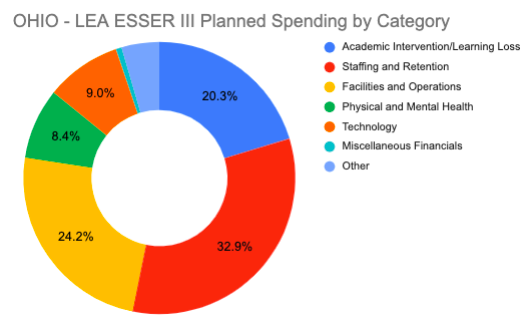
Ohio is spending a very similar percentage on Facilities and Operations, and Technology, compared to both the California and national examples. However, Ohio plans are less specific about how staffing spending was assigned, and it is likely that some of those staffing dollars actually could be assigned to Academic Intervention and or Physical and Mental Health which would shift those percentages closer to the national totals.
 |
Next week we will be looking at the charter school versus non-charter breakout priorities in ESSER III, among other topics.
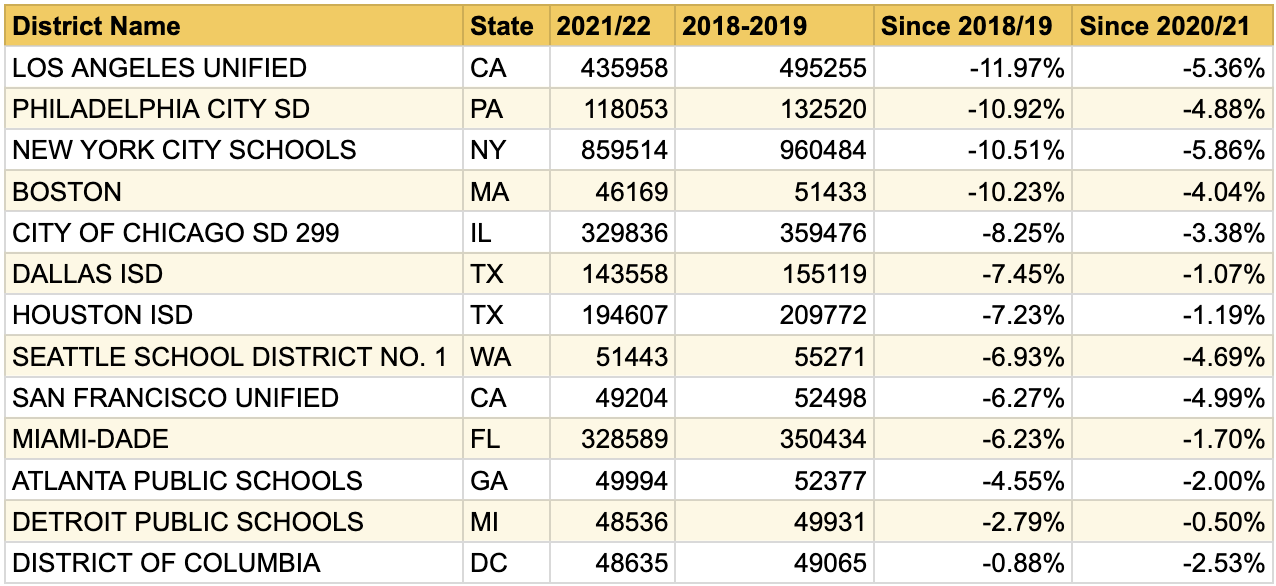
2. As we have noted, the National Center for Education Statistics recently released enrollments for the 2021/22 school year. A frequent point of discussion is how districts are comparing versus 2019/2020, the year before Covid 19. Our analysis found just over 400 of the largest 500 districts, or just over 80%, lost enrollment during the two year period between 2019/20 and 2021/22. As a point of comparison, just under 50% of those Top 500 districts lost enrollment during the more recent one-year period 2020/21 and 2021/22.
As part of a bigger project evaluating school budgets, spending, and enrollment, and how they interact, we are starting to look further back in the NCES data.
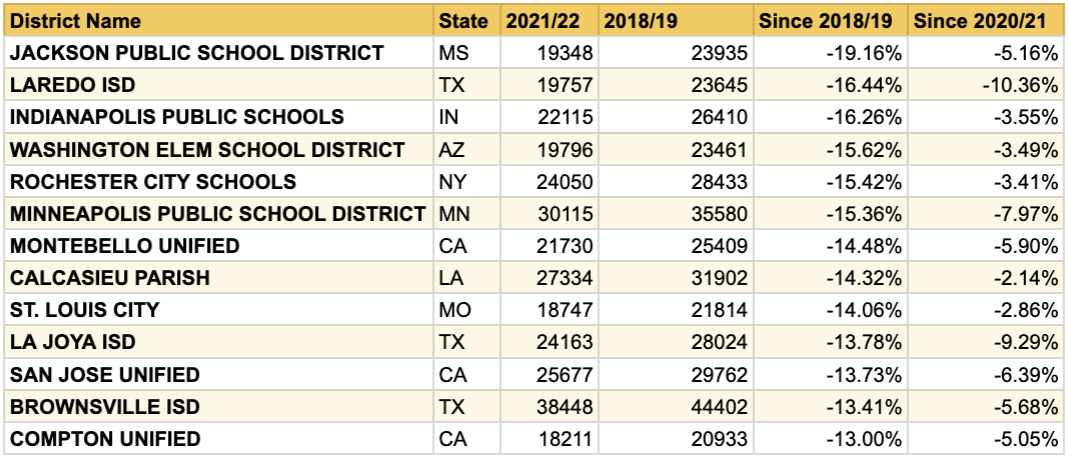 |
For additional perspective, below is a list of the city districts from some top metropolitan areas from across the US during the same period. In future weeks, we will be looking at top gainers during that period:
 |
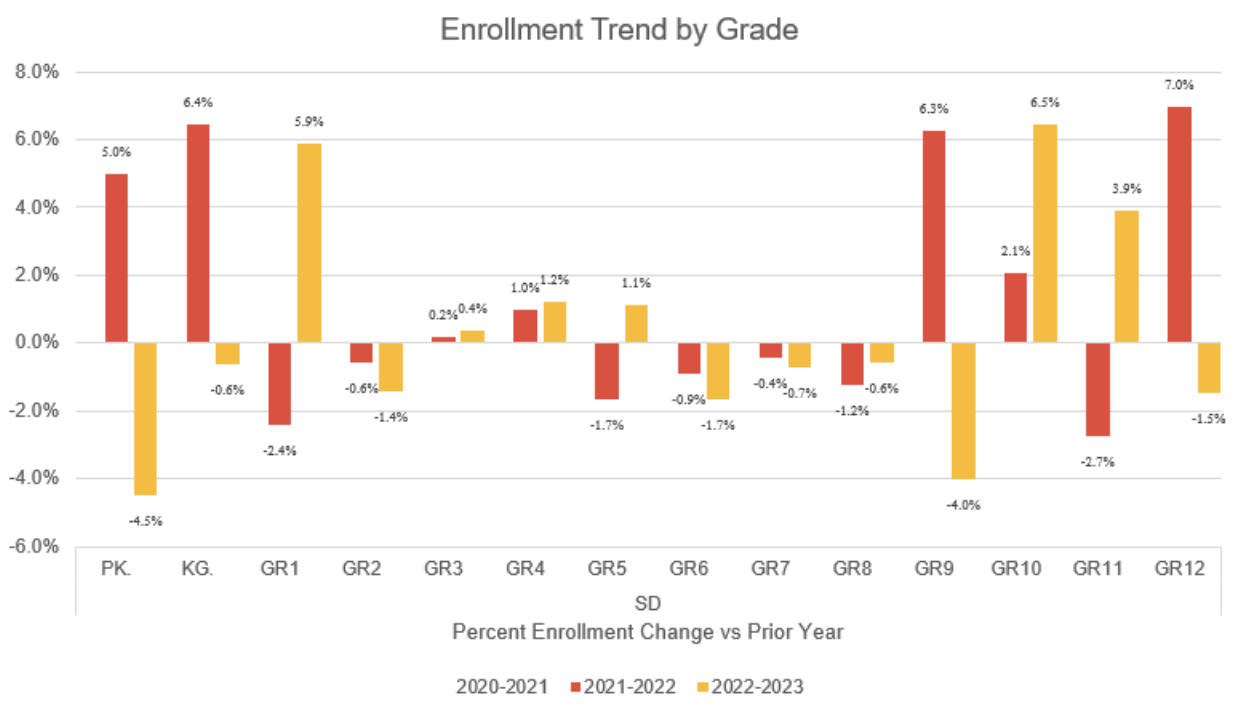
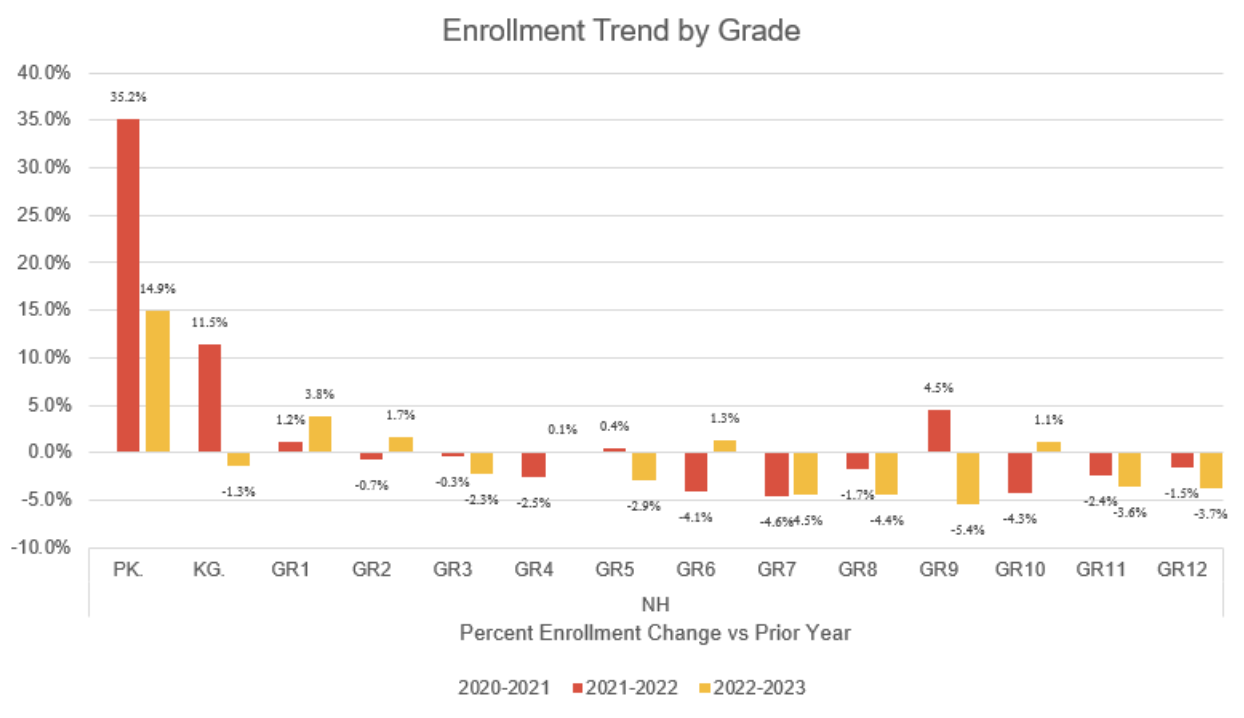
3. In recent weeks we have noted the growth in Pre-K enrollment in many states. As we continue to add enrollments for 2022/23 (updated on our Enrollment Tracker page) we note the 2021/22 academic year saw an increase in kindergarten enrollment in many states, potentially due to parents deferring enrollment during 2020/21. Unlike Pre-K, which appears to be a one-time expansion of enrollment (children being enrolled a year early into a program that didn't previously exist) the kindergarten increases appear to carry through to first grade the following year. Below is analysis from states that have recently announced 2022/23 figures. Note the increases in kindergarten last year (in red), while first grade (in yellow) has also increased this year, albeit at a slightly lower rate. As more states announce this year’s results, we will continue to evaluate whether the Class of 2034 (today’s first graders) will be slightly bigger than otherwise might have been the case. Below is the new data from New Mexico, South Dakota, and New Hampshire:
 |
 |
 |
This week we update our enrollment analysis with the addition of complete enrollment figures from Vermont, district-level information for Rhode...
This week we look at districts with increasing enrollment, including some that have not recovered back to pre-Covid-19 levels.
Burbio's School Budget Tracker documents detailed K-12 spending, and as part of that initiative we see discussion of district enrollments. This week...