School Bonds
Burbio School Tracker 5/6: Preliminaries
This week we present analysis of staffing levels for districts across the country, take a look at preliminary school budgets, and review a market...
This week we look at a national analysis of school district exposure to the "fiscal cliff," the substantial incentives for K-12 infrastructure built into the Inflation Reduction Act (IRA), and additional strategic plan analysis.
1. Earlier this Fall we conducted state-level analysis for Pennsylvania, Texas and New Jersey as to the level of drop-off exposure when ESSER III funding expires. This week we take a look at figures nationally. Given that the vast majority of states don't provide district-level budget summaries, we are using NCES school finance data for this analysis, which requires some assumptions:
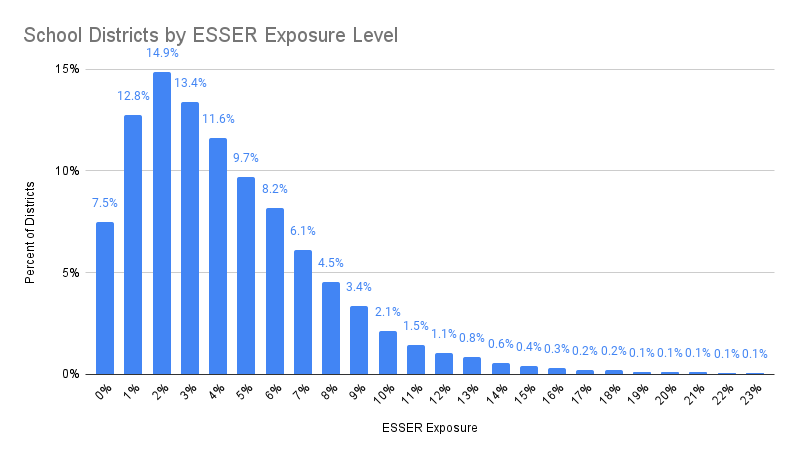
Our first chart is a histogram showing the distribution of districts by exposure level:
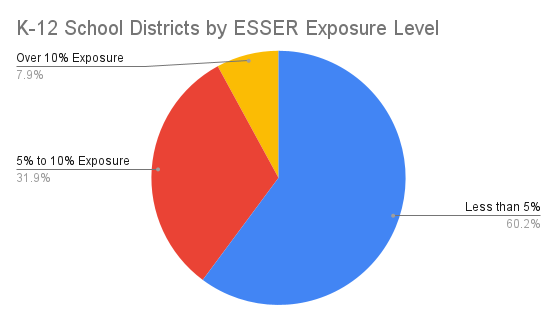
Next is a pie chart that summarizes the bar chart above. A total of 7.9% of K-12 districts have over 10% ESSER III exposure, and 31.9% have exposure between 5% and 10%:
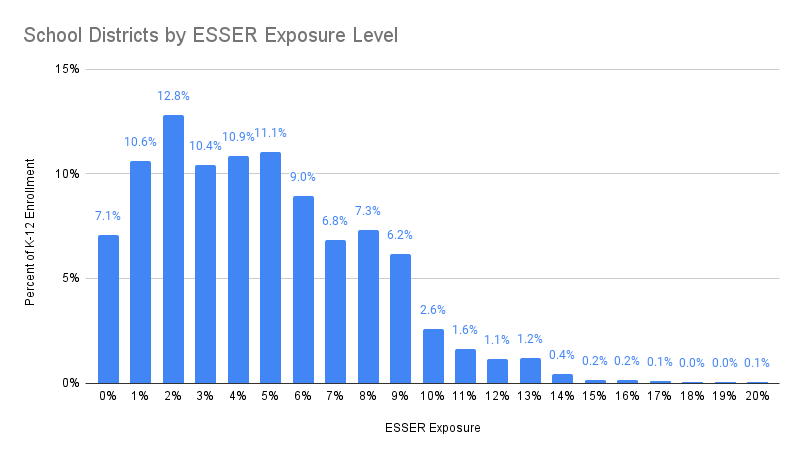
The next part of the analysis examines the percentage of students attending districts with levels of ESSER III exposure. First a distribution by exposure level:
Next up is a pie chart analysis summarizing the enrollment figures in the chart above. In total 48.2% of K-12 public school students attend districts with 5%+ exposure:
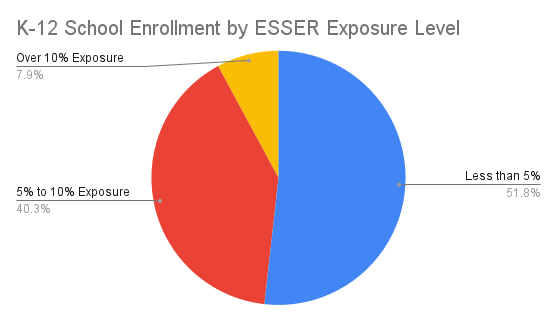
Note that in the two pie charts the percent of districts, and percent of students attending those districts, with over 10% exposure is the same (7.9% in both cases). While many large districts have a high percentage of students who qualify as economically disadvantaged and thus a higher ESSER III allocation and more ESSER exposure, so do many low-enrollment rural districts and low-enrollment urban charter districts. That dynamic of high enrollment and small enrollment districts results in the percent of districts and students being identical.
2. In the coming weeks Burbio will continue to expand our data services compiling revenue sources available to school districts. This week we wanted to start by highlighting the impact of the Inflation Reduction Act (IRA) on school infrastructure. While the wide-ranging legislation covers areas such as drug pricing, funding the IRS, and corporate tax rates, the bulk of spending involves incentives for clean energy, including K-12 schools.
For school districts, the legislation has some unique characteristics related to reimbursement for qualifying spending:
Eligible spending categories include ground source heat pumps. solar, electric vehicles, energy storage, electric charging, and more. The credit calculation, outlined in the first ten minutes of this video, can result in dramatic changes in project economics. Below is a chart from UndauntedK12 highlighting an example of an $11.3 million HVAC project whose net cost drops to $5.8 million after incentives:
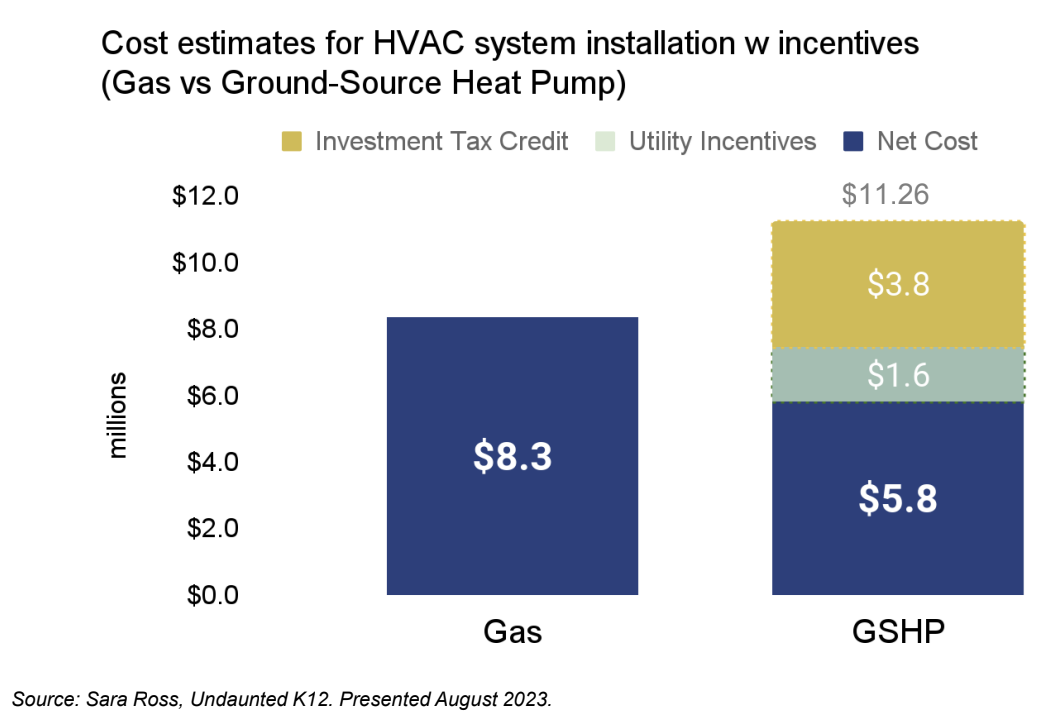
Given the broad availability of this funding, the significance of the economic opportunity, as well as the time horizon on the legislation, we expect this to have a dramatic impact on school construction in the coming years.
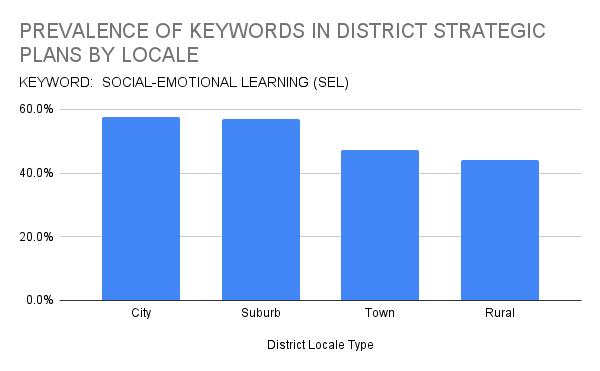
3. Burbio's searchable database of K-12 strategic plans and LCAPs is now at over 3,000 districts covering over 66% of K-12 students. This week we continue with our series looking at the differences in key terms mentioned in strategic plans by NCEC locale. The term social and emotional learning (SEL) is mentioned most frequently in city and suburban districts' plans, with the lowest amount of references being in rural:
This week we present analysis of staffing levels for districts across the country, take a look at preliminary school budgets, and review a market...
In this week's Tracker we review the Comprehensive Literacy State Development program, examine spending references in school budgets, and dig deeper...
In this week's Tracker we review state grant categories heading into 2025, additional market penetration analysis for top industry vendors, and...