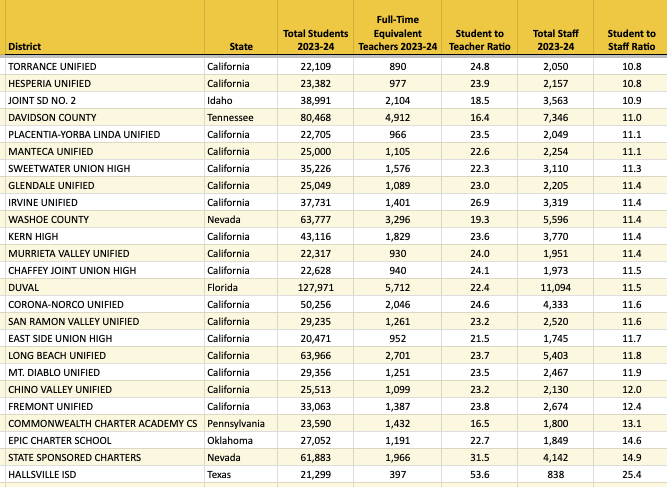
1. As school districts propose and approve 2025-26 budgets, one area of discussion is staffing levels, in particular in districts with declining enrollment and a decline in Covid-era Federal funding. This week we start by looking at staffing levels for districts across the country. For the analysis, we used 2023-24 NCES data for districts with over 20,000 students. The charts below are ranked showing the districts with the highest amount of staff for each student (the lowest Student to Staff Ratio). In a separate column we present the Student to Teacher ratio.
The first chart shows the 25 districts with the highest amount of staff per student. Further below in this newsletter, we present Districts 26-50, as well as the districts with the lowest amount of staff per student:
2. In addition to datasets such as state grants, board documents, bonds, and strategic plans, Burbio gathers PreK-12 school budgets. This week we use Burbio's Signals Tracker, which allows highly contextual questions of our data, to ask, "Which districts have presented preliminary budgets to the public?" This results in some important insights.
Financial statements for the operating budgets provide poor visibility into district spending specifics due to use of generic line item accounting codes ("instructional materials", "supplies"). But Burbio also gathers budget presentation summary documents that describe what the district is prioritizing. Opportunities appear even in districts with declining enrollment and budget pressures. Some examples:
- Bridgewater Raritan School District, NJ is piloting full day kindergarten, implementing career concentrations, expanding robotics, engineering, and foundational literacy, supporting ESL services across the district, and implementing BRITE Learning Labs. The district has seen a 4.4% decline in enrollment and is reducing headcount while increasing spending by 2.6% in 2025-26.
- The City School District of Albany, NY, notes priorities including 11 Career and Technical Education Pathways, instructional intervention positions to support math, reading and ELA, social and emotional supports, expanded advanced placement, and extensive high school arts programming. District expenditures are increasing 4.9% while staffing is dropping by 300 positions to below 2019-20 levels.
- Cherokee County School District, GA, cites improving CTAE offerings and CTE Pathways, infrastructure investments in security, furniture and HVAC, and enhancements to ELA and math. The district's enrollment has been gradually increasing, expenditures will increase by 3% in 2025-26, while the central office budget is being reduced by 3%.
- Baltimore City Schools, MD is prioritizing accelerating student achievement in literacy and math, college and career readiness through a Secondary Success and Innovation Program, improving attendance, and mental health services, while detailing dozens of additional initiatives from summer programming to the arts to credit recovery. District expenditures are projected to increase 5% next year.
- Aiken County Public School District, SC is expanding their multi-language learner program, adding teachers for ELA and math, adding six social workers to the high school level, reorganizing their technology department to reduce contracted services, and reorganizing both CTE and Special Education services to better deliver programming, while increasing spending next year by almost 10%.
This Signals Tracker is used for any question about district activity at any stage of decision making, such as curriculum reviews, technology evaluations, capital spending plans, and program expansions. For a demo of this capability click here to schedule a meeting.
3. Burbio maintains a database of district checkbook registers covering over 20 million PreK-12 students. We are introducing a feature that provides "last twelve months market penetration" for companies designated by clients. Information is searchable down to the district level, and clients use the information for competitive intelligence. Below are some examples of this analysis for select industry suppliers: 
This service can be customized by clients so, for example, a tutoring vendor can check market penetration for other tutoring companies, a mental health services provider can do so for suppliers in their industry, etc.
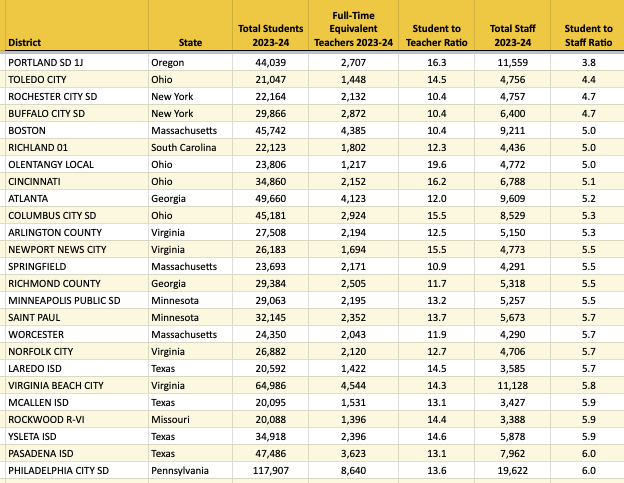
4. Continuing our staffing analysis, the next chart is districts 26-50, ranked by highest ratio of staff per student:
There were 391 districts that were captured in our analysis. (Note: large districts in Utah do not have staffing levels indicated in the NCES data and cannot be included).
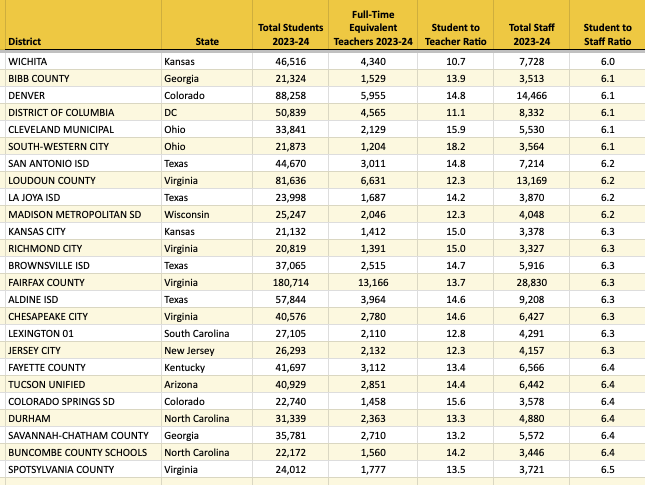
For perspective the list below is the bottom 25 districts on the list, districts with the lowest number of staff per student.