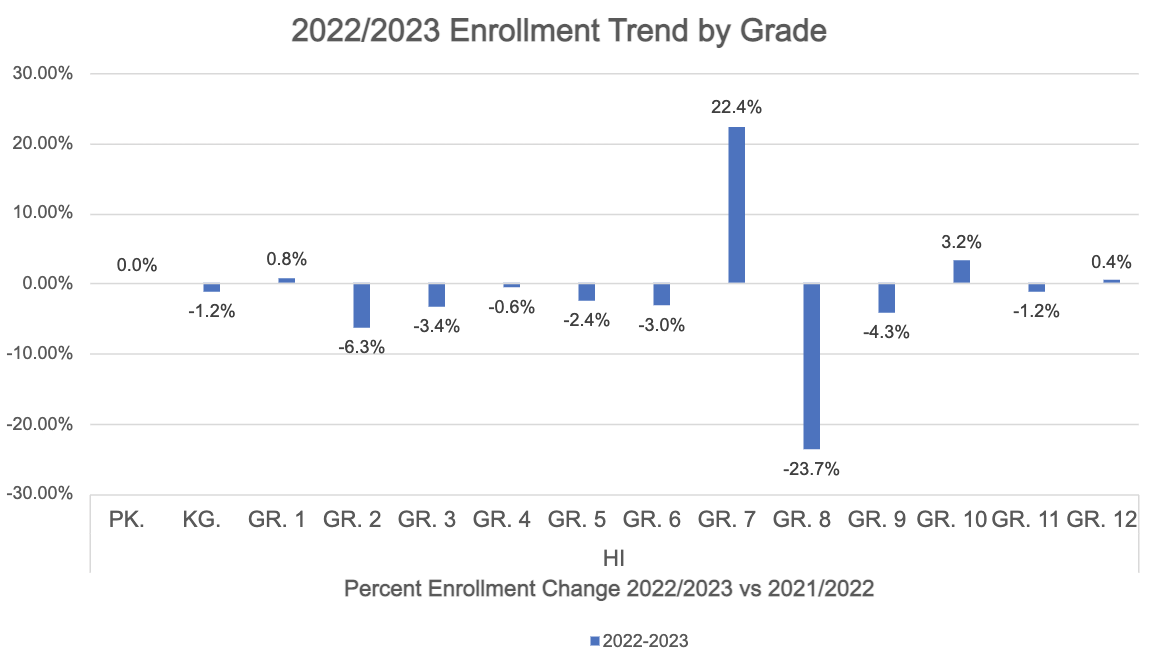
1. As part of our ongoing work on K-12 school spending and operations we will periodically present state-level 2022/23 enrollment figures as they are announced across the US. Hawaii recently announced that public school enrollment had declined for a fourth straight year, dropping 1.7% versus a 1.8% drop for the 2021/22 academic year. Hawaii operates as one school district. Below is the grade by grade change:
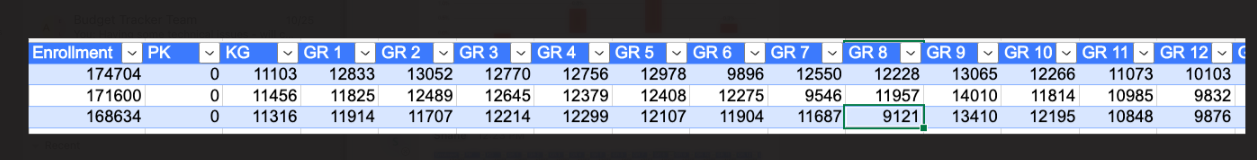
The decrease in eighth grade enrollment (and corresponding comparative increase in seventh grade enrollment) can be seen in the figures below which shows the current eighth grade year being much smaller than other grades in the system over the past three years:
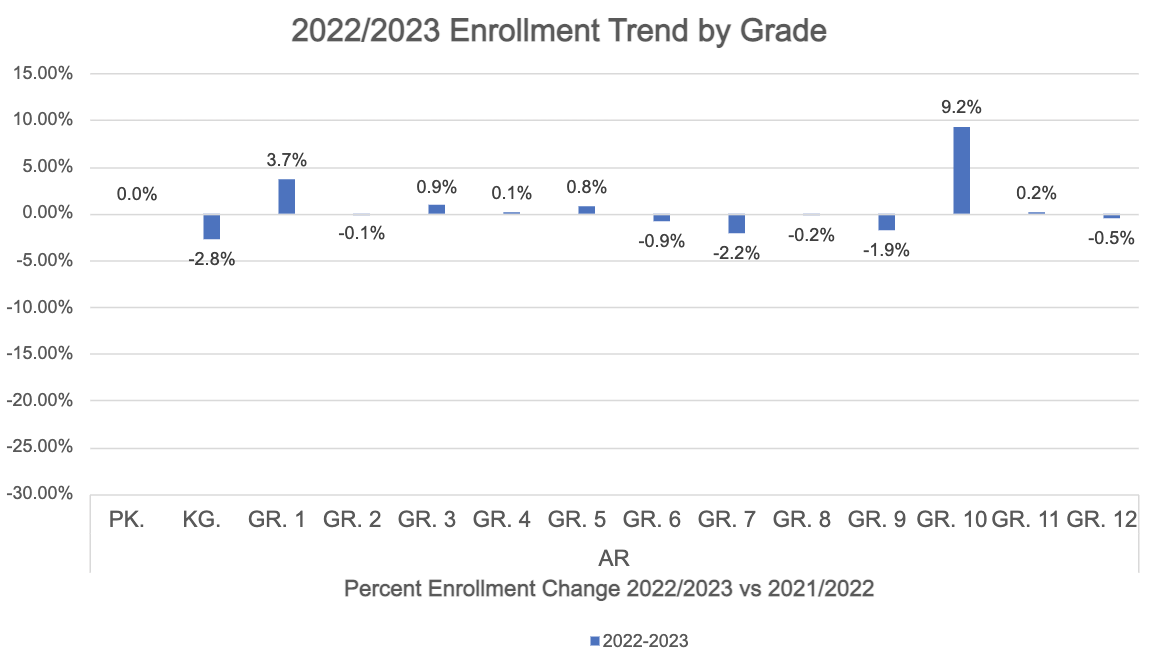
2.In Arkansas, enrollment increased by 0.6%. Below are the grade-by-grade breakouts. The increase in grade ten reflects a pattern from last year's Arkansas figures, when there was a spike in grade nine due to retention policies that had a greater impact during Covid-19. This piece in The 74 from May 2022 describes the phenomenon, which occurred in over a dozen states concentrated in the South.
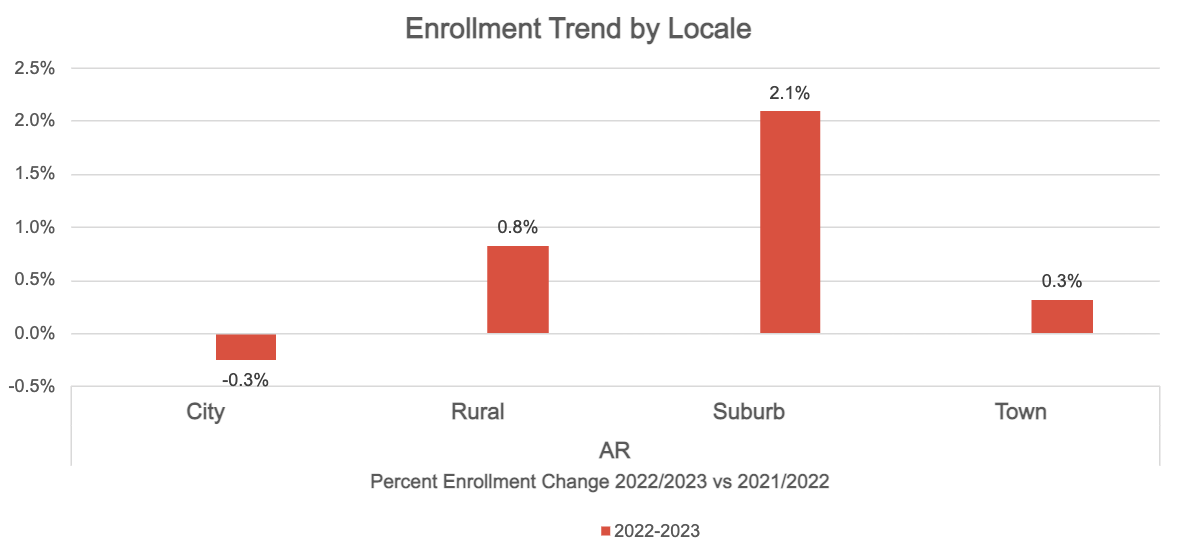
Below is the shift in enrollment by NCES locale classifications. City enrollment was the only locale that declined. While locale enrollment patterns vary widely by state, last year city districts declined nationally.
3. During the 2020/21 school year, Burbio audited 1,200 school districts across 50 states for in-person learning status. Districts were reviewed every 72 hours and graded from virtual, to hybrid, to traditional in-person. The
methodology can be found here and charts and time-series illustrations can be found on the
School Opening Tracker page in the 2020/21 section. Selected districts were spread across the US to represent local geographies and in-person indexes can be rolled up to the county, state, and national level on a student-population weighted basis. The in-person index (IPI) reflects the percent of the school year students had access to in-person instruction.
 |
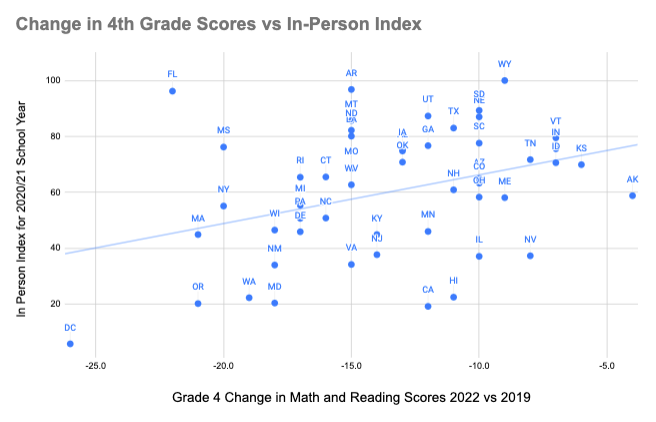
For the recently announced NAEP test results scores declined nationwide and multiple news reports and researchers have begun dissecting the results. Burbio's approach is to provide data to third party researchers and media outlets for investigation, and that will continue. This week we did run the scores against the state-level IPIs charted above. When we ran the 8th grade scores against the state-level in-person indexes, we didn't see much of a relationship. The fourth grade results, while not uniform, did show a bit more of a correlation and we chart it below:
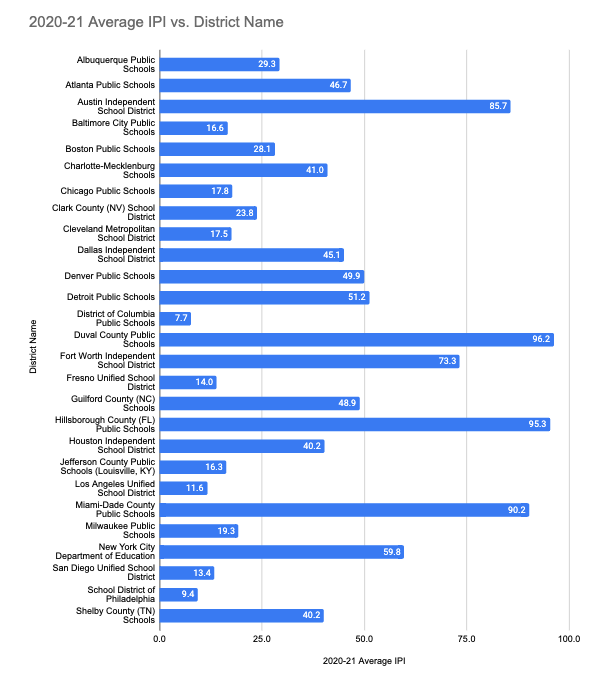
Finally, NAEP provides details on a subset of urban districts known as Trial Urban District Assessment (TUDA) and with the publication of the recent district-level test results we wanted to share Burbio's in-person index scores for the 2020/21 school year for those districts.