Last week Burbio conducted an industry webinar titled, "Targeting K-12 Districts With Available ESSER III Funds." What follows is some of that analysis, including several charts that did not appear in our presentation. For a copy of the presentation email dennis@burbio.com.
Thanks for reading Burbio School Tracker! Subscribe for free to receive new posts and support my work.
1. FY 24 is the final full fiscal year where K-12 districts can spend ESSER III funds. Burbio tracks the amount of ESSER III funding that has been spent by districts nationwide, and also has compiled detailed, searchable district plans representing over 83% of K-12 students.
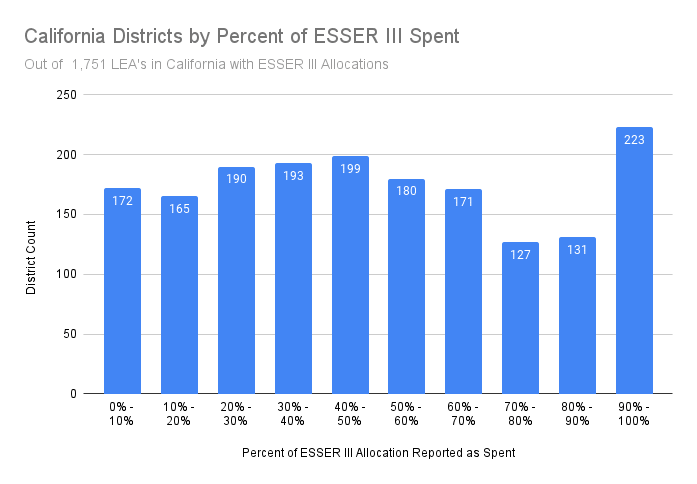
We start with some analysis from California. The following chart breaks down the number of districts by percentage of their allocation that has been spent. Over fifty percent of the districts have reported spending less than half their ESSER III funding to date:
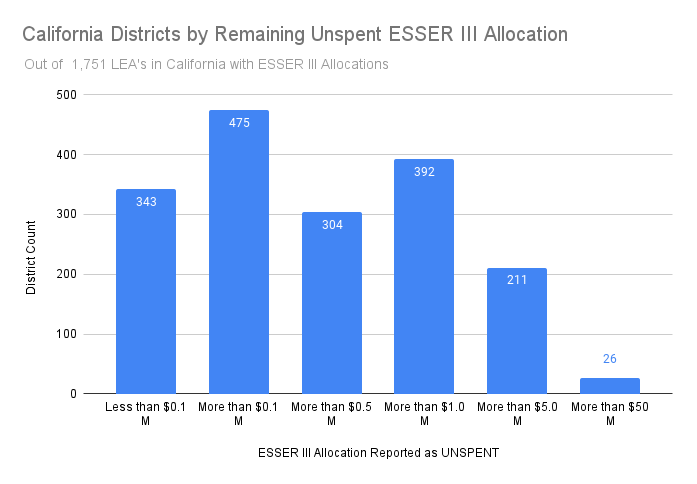
Another way to evaluate the data is to look at districts that have the most available dollars unspent in absolute terms. From the chart below you can see 26 districts in California have over $50 million in unspent funds and 211 have between $5 million and $50 million:
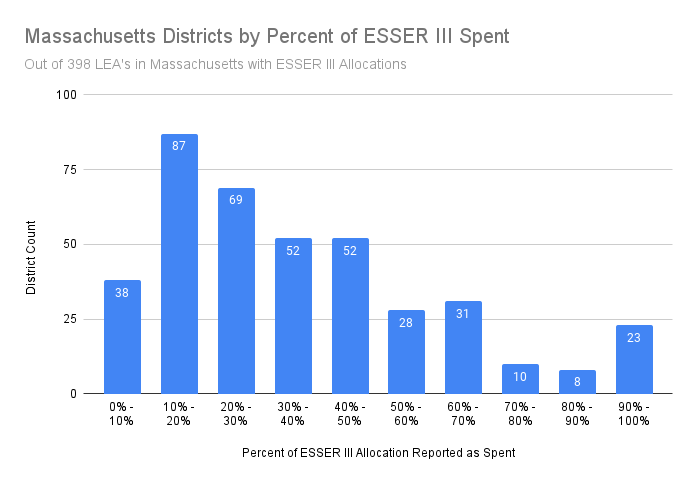
2. In Massachusetts, noted below, almost three-fourths of districts have reported spending less than half their ESSER III funds:
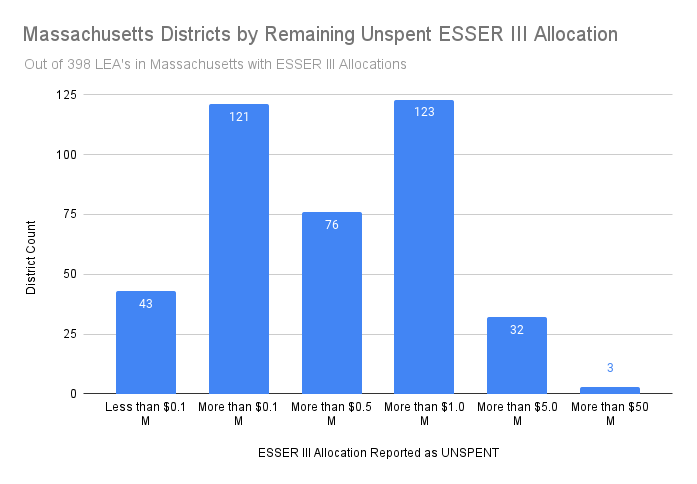
Three districts in Massachusetts have over $50 million of unspent funds and 32 have between $5 million and $50 million:
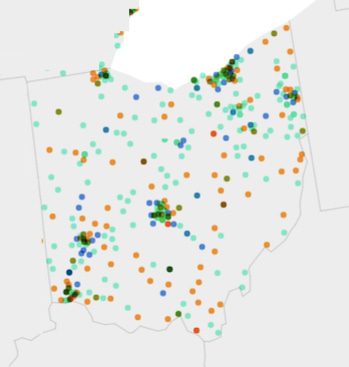
3. Another way to think about the analysis is to combine the two factors and develop priorities. Below is a scatter map of Ohio districts, with criteria laid out in three buckets: 1) Orange are districts that have both over 60% of their ESSER III allocation available and over $2.5 million remaining; 2) Aqua dots are districts with more than 60% of their allocations unspent but less than $2.5 million remaining; 3) Dark blue are districts with more than $2.5 million available but less than 60% of their funds unspent:
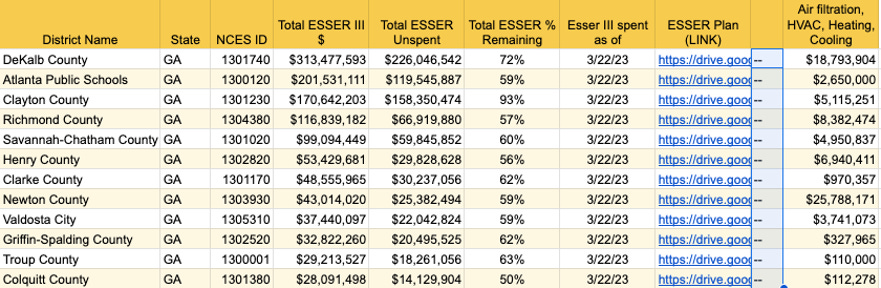
3. For certain stakeholders a key variable is whether a district intends to spend in a certain area. The chart below shows districts in Georgia with over 50% of their allocation remaining that have indicated they are investing in HVAC:
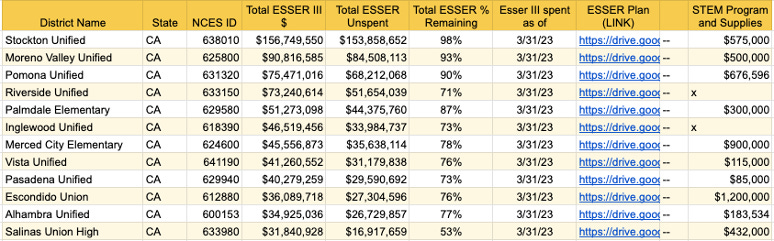
Below are districts in California with over 50% of their funding who have indicated they are spending on STEM program and supplies:
This analysis can be done against any category, and also combined with keyword references in plans where appropriate.
4. This week New Jersey announced their 2022/23 enrollment and reported an increase of 0.8% versus 2021/22. Below is the breakdown by locale with the most recent year in yellow. The state has reversed a slight decline in suburban enrollment from last year. Suburban districts make up by far the largest locale category in New Jersey:
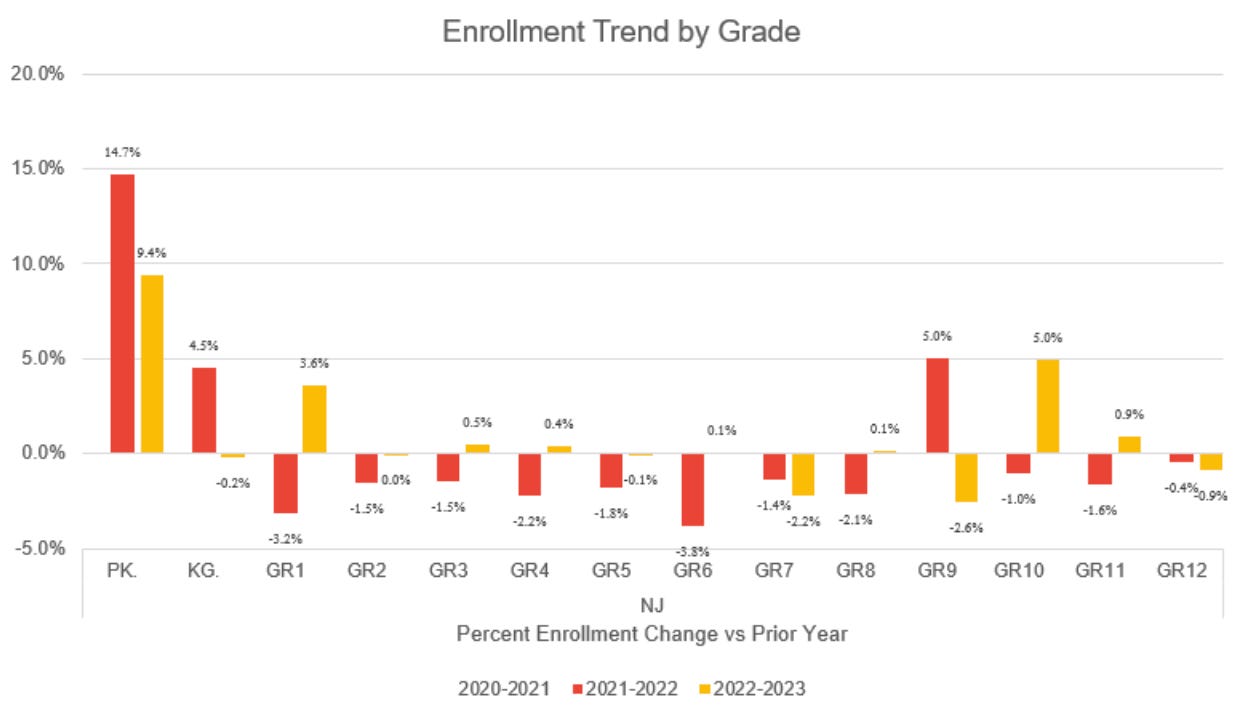
Below are enrollment trends by grade with New Jersey showing increases in Pre-K, Grades 1, 3 and 10, similar to many other states: