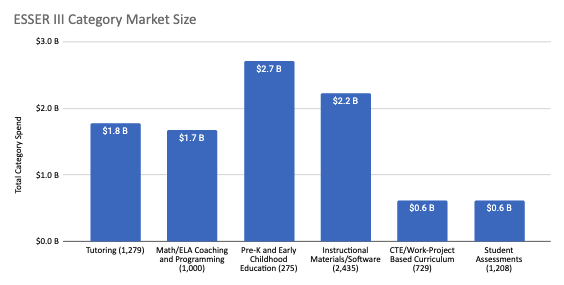
1. Burbio's ESSER III dataset breaks down spending into almost 100 categories, allowing partners to use the data very specifically for market intelligence, addressing districts' needs, and policy analysis. As our district set now covers 81% of the K-12 public school population we wanted to size some of the markets. The chart below is an example of a category, number of districts indicating intent, and the dollars being allocated for some academic initiatives:
From above, 1,000 districts are spending $1.7 billion on Math/ELA, 729 districts are spending $600 million on Career Training and Work-Project Based Curriculum, 275 districts are spending $2.7 billion on Pre-K and Early Childhood, etc. These are just a few of the nine figure and $1 billion-plus markets coming out of ESSER III.
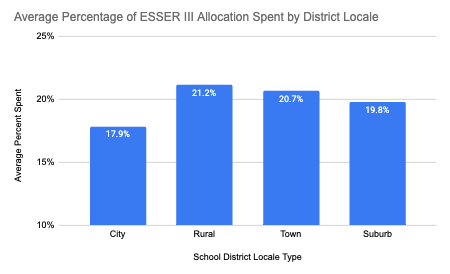
2. This week we look at the percent of ESSER III spending reported based on
locale codes. Note that City districts are reported spending at a slightly slower rate than Suburbs, with Town and Rural having spent slightly faster than both. This is consistent with
last week's observation that bigger districts are spending money at a slightly slower rate than smaller districts.
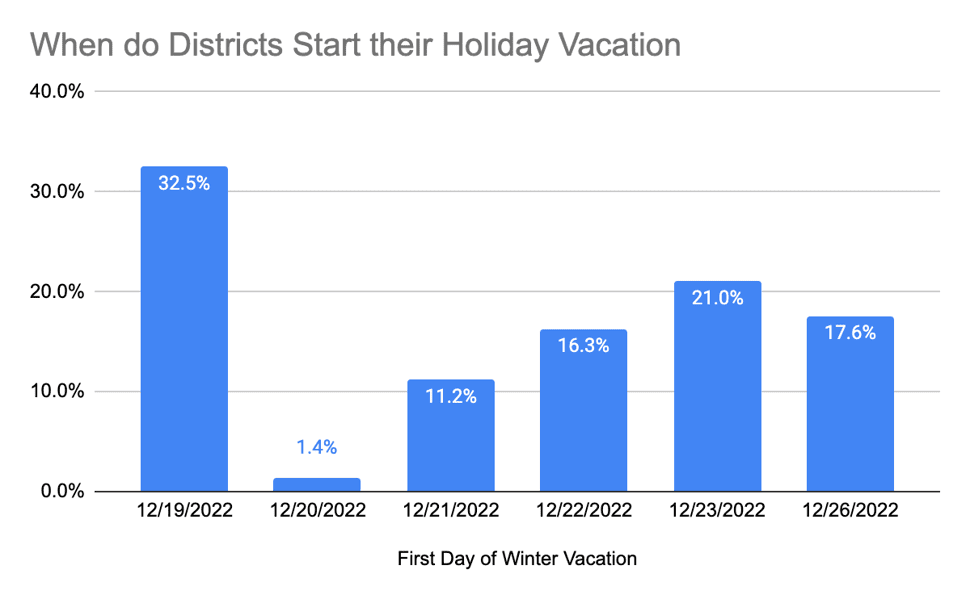
3. One of the things we do at Burbio is think about the economic effect of schools on local communities and something as simple as whether a school is open has an impact on local retailers, suppliers in industries such as food and transportation, local employment, and more. Regional differences in school calendars mean national companies need to staff and supply differently based on the schedules of the local market. Even Christmas Break can vary. Note below that almost one-third of US K-12 students start the holiday on December 19th, a week early, while another 17% don't start until December 26th:
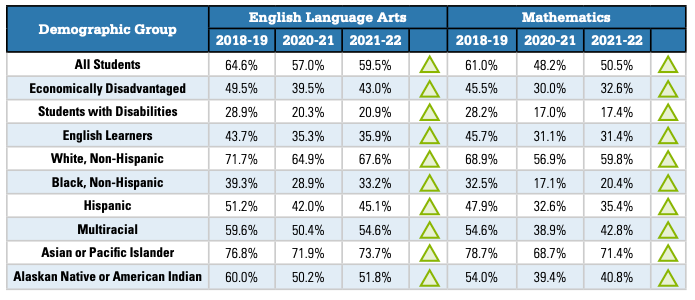
4. We continue to see references to states releasing their test results and here are a few of note. While the pattern remains similar in most states (Iowa's pattern is a bit different, see below) the presentation of the information varies and can offer different insights.
In
Ohio students remain between 7 and 12 percentage points behind 2019 in Math and 3 to 8 points behind in ELA depending on the group:
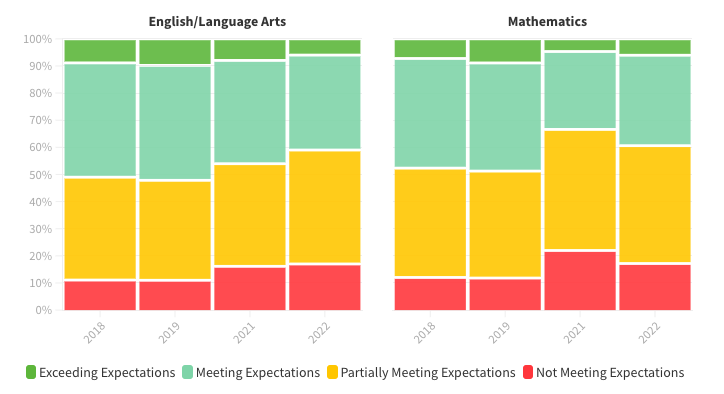
In Massachusetts this local news story breaks out state performance; the red indicates "Not Meeting Expectations;" both ELA and Math remain behind 2019, with ELA worsening slightly from last year:
Finally, these local media reports have a good overview on
Iowa, where English and Science actually exceed 2019 while math lags, and
Wisconsin, where scores rebounded slightly versus last year but are behind 2019.