1.The National Center for Education Statistics recently released full enrollments for the 2021/22 school year. Over the Fall Burbio has been reporting on 2022/23 enrollment figures - this academic year - as they are announced at the state level, and we will continue to do so. State-level announcements occur 12 to 15 months before the Federal government data. The NCES 2021/22 figures, while less timely than the state-level reporting, does offer a normalized view of enrollments nationwide and we wanted to provide a snapshot.
As we have noted in
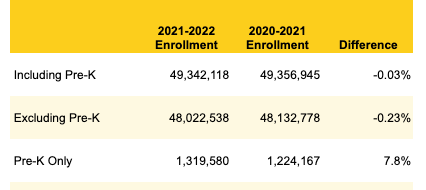
previous posts there has been an expansion of Pre-K enrollments in the last two years that have masked trends in K-12. Below are national NCES figures for 2021/22, with Pre-K trends broken out. Note Pre-K enrollment rose by almost 8% during the period:
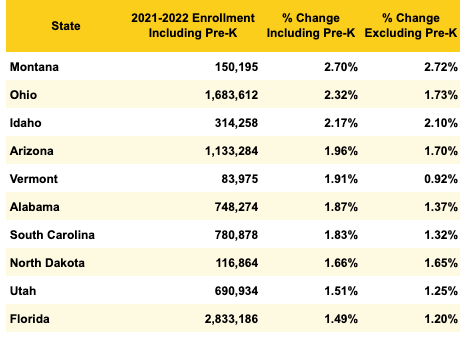
2. Below are the ten fastest growing states from 2020/21 to 2021/22 with their 2021/22 enrollments. For each state we have added a column stripping out the respective Pre-K enrollment figures:
3. Below are the ten states with the largest declines from 2020/21 to 2021/22, again with a column normalizing for K-12:
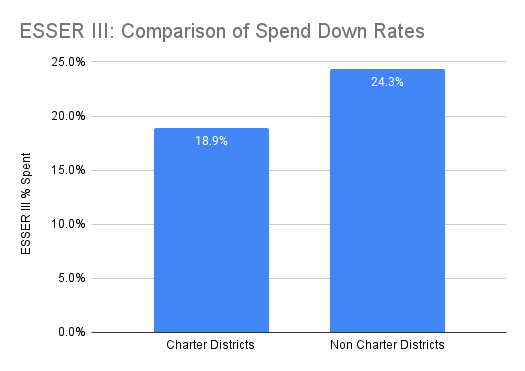
4. As we continue to expand our ESSER III spending database we are going to be breaking out different sub-segments, both for what they are spending money on and how fast they are spending it. This week we look at the pace of charter school reported ESSER III spending. As we noted last week, pace-of-spending comparisons can be tricky due to different state-level reporting. For this week's analysis, we look at the difference in ESSER III spending rates between charter and non-charter districts in across ten states that reported since August 31st. The analysis includes 563 charter districts and 2,940 non-charter districts. The analysis shows charters had spent 18.9% of their ESSER III allocation, versus 24.3% for non-charters:
 |
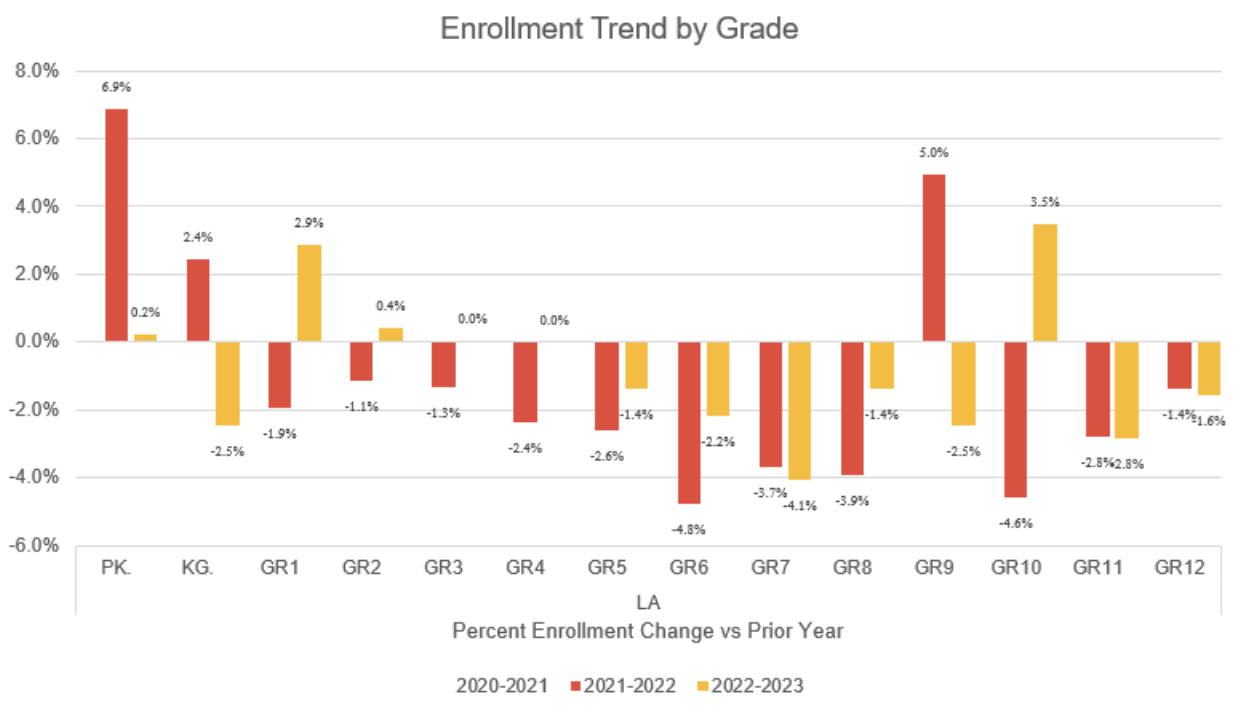
5. One of the questions raised by Pre-K enrollment increases during 2021/22 is whether they will result in increases in kindergarten enrollment in 2022/23. It is too early to make a firm observation, as just under twenty states have reported their 2022/23 enrollments, but the answer so far is "No." Louisiana's recently announced 2022/23 grade-level results, below, offers a representative snapshot of what we are seeing. In 2021/22 (red), there was a 6.9% increase in Pre-K. In kindergarten this year (yellow) enrollment decreased by 2.5%. Louisiana reports a 0.7% overall enrollment drop for this academic year:
 |
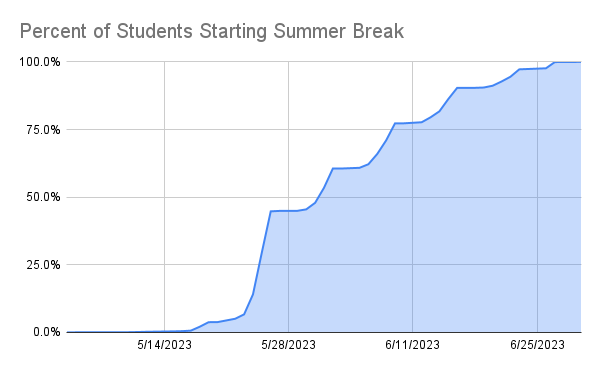
6. The economic impact of K-12 schools being open - as opposed to being on vacation or break - can be dramatic for "out-of-school" businesses such as retail, travel and leisure, and childcare programs, plus in-school services such as school meals. School breaks vary widely across the U.S, and Burbio's school calendar data is used by clients to manage demand. Below is a chart showing the percent of students on summer vacation by week this coming Spring. Note that just over half of students are on break by early June: