School Grants
Week of 1/23: Charter vs Non-Charter
This week we look at the difference in stimulus spending between charter and non-charter schools, enrollment trends broken out by free or...
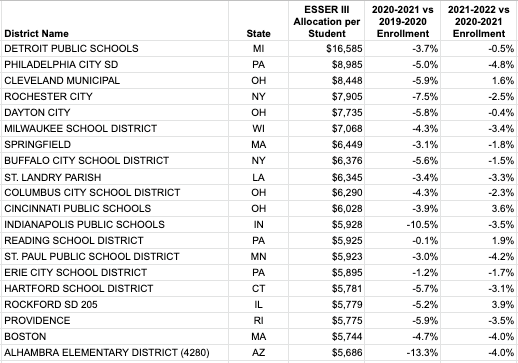
This week we take a look at enrollment trends in districts getting the highest levels of ESSER III funding.
 |
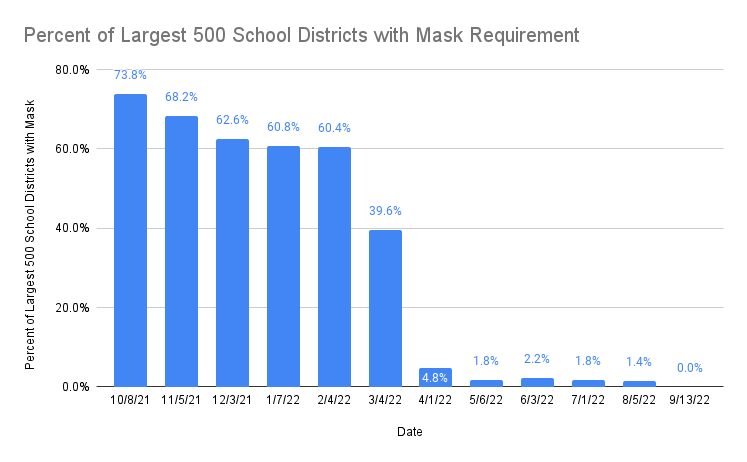
2. This week Newark Public Schools, NJ eliminated its mask mandate, and the number of Top 500 school districts with mask mandates is currently zero. Below is a chart showing the shift in mask-mandates since October 2021. March 2022 was the largest shift with over 30% of the Top 500 districts moving to mask optional that month:
 |
3. Staff shortages in areas such as bus drivers and cafeteria workers have been widely noted over the last few months, and this week we see references nationwide to a shortage of referees for school sporting events. Stories out of Oregon, New York, Colorado, California, Oh
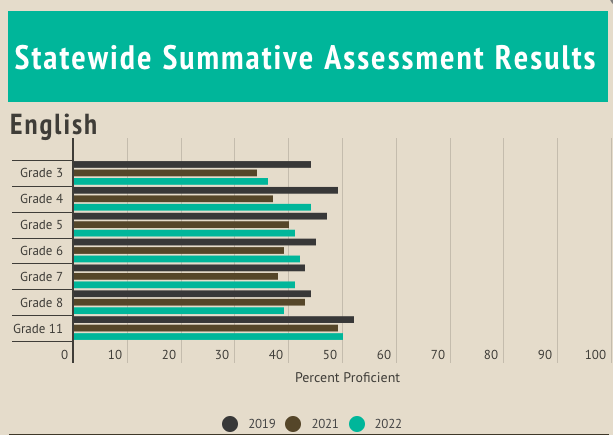 |
Next, Minnesota, where Reading and Science fell further behind this past year:
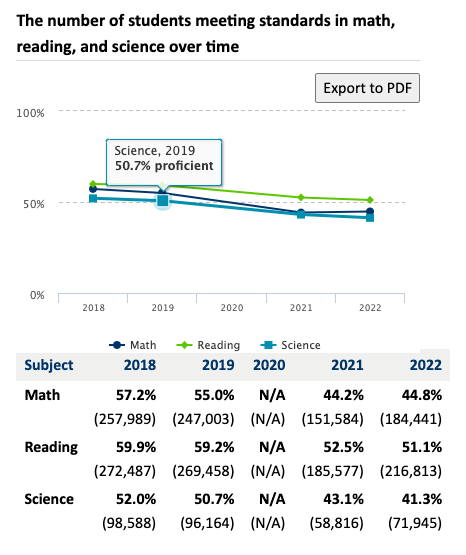 |
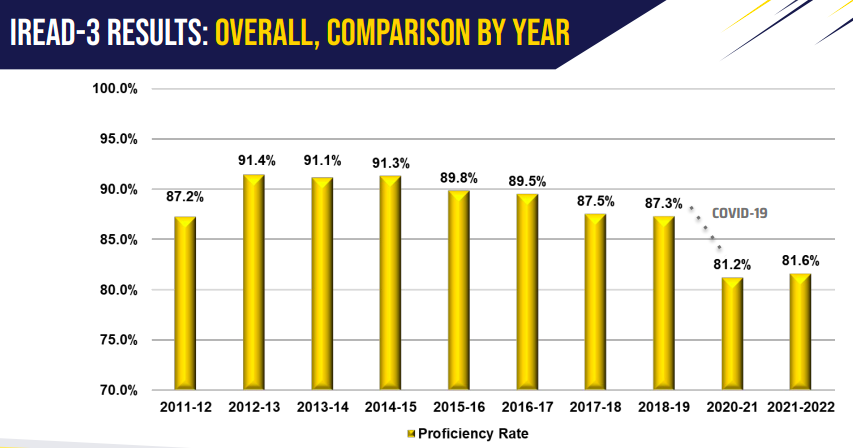
Finally, from Indiana, results from the Indiana Reading Evaluation and Determination (IREAD-3), the state's grade three reading assessment:
 |
This week we look at the difference in stimulus spending between charter and non-charter schools, enrollment trends broken out by free or...
District budgets are often highly detailed and thus our spending categorizations are very granular, but they can also be rolled up to see higher...
This week we look at districts with increasing enrollment, including some that have not recovered back to pre-Covid-19 levels.