In the late Fall of 2020 during an update call, one of our clients - an intelligence analyst at a global conglomerate - casually referred to Burbio's school disruption data as a "source of truth" in the midst of the signals they were ingesting at the height of Covid- 19. We took the compliment as a mission statement for all Burbio's services, which have since expanded. As 2023 begins we are accelerating the pace with which we gather details on K-12 school spending, enrollment, and operations, and will be presenting new indexes and analysis in these newsletters.
Burbio will be speaking at the Digital Learning Annual Conference on February 14th in Austin, TX, discussing Enrollment and Spending Trends in K-12 Education. Please let us know if you are attending - we would love to connect.
1. This week we are updating our K-12 ESSER III spending analysis to reflect our current database of 6,000 districts. We will be expanding the database to 7,000 districts and updating plans as they are changed during 2023, and will adjust the summary below accordingly. Burbio has district plans covering over 83% of K-12 enrollment and over $92 billion of ESSER III allocations, which represents 83% of the $110 billion sent directly to LEAs:
 |
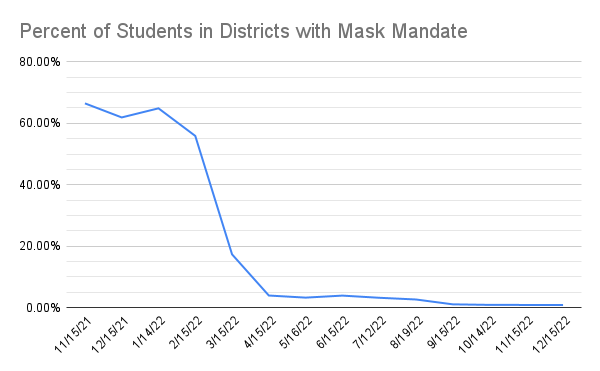
2. K-12 public school mask mandates have fallen to below 2% of districts from the start of this academic year, and into the winter,
even as a small number of districts such as Philadelphia, PA and Passaic Public Schools, NJ require masks at certain Covid-19 thresholds. Given the tiny figures involved, Burbio will no longer be tracking mask mandates going forward. Burbio tracked 5,000 district mandate policies from October 2021 through December 2022. Below shows a chart with the percentage of US students going to schools with mask mandates during that period. The information can also be found on Burbio's Mask Policy Tracker:
 |
Similarly, even as illness-related school disruptions numbered in the hundreds over November and December, that amounted to at most between 0.1% and 0.3% of US K-12 schools on a given day, and we are winding down that piece of our tracking project. Later in January we will be creating a free, downloadable, state by state overview of in-person Indexes based on our continual measurement of districts since the Fall of 2020 via our School Tracker page and will announce when that is live.
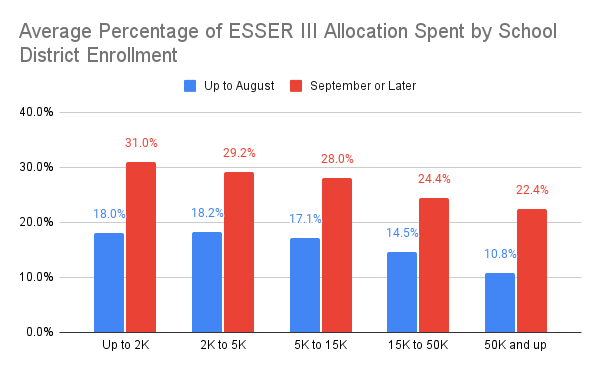
3. Burbio continues to monitor spend down rates for ESSER III plans and publishes monthly updates to partners. Districts have until September 2024 to obligate funding. In evaluating spending trends, one of the challenges is that reporting dates across states are inconsistent; they vary from daily to quarterly to "every-few-weeks-or-so," as it were. In an effort to evaluate district spending pace by district size, we examined 16 states and compared reporting dates in Q3 and Q4, respectively. Below is a chart that shows the ESSER III spend-down rates broken out by school district size. The largest and smallest districts had the biggest gains (13% and 11.6%), with the percent-spent of the largest districts more than doubling from 10.8% to 22.4%. The middle sized districts went up 10%, 10.9% and 9.9%, respectively.