1. Burbio tracks school board meeting minutes covering over 50% of the K-12 public school population. School board meetings cover all facets of school district operations. We covered examples in a June post of "pre-RFP" discussions covering academic programs and capital expenditures across a number of district board meetings that is representative of what is discussed.
This week we begin by looking at staffing, mental health and special education categories. A few notes:
-
For this survey we covered the last three school board meetings for districts representing just under half the country with districts from every state and the District of Columbia represented.
-
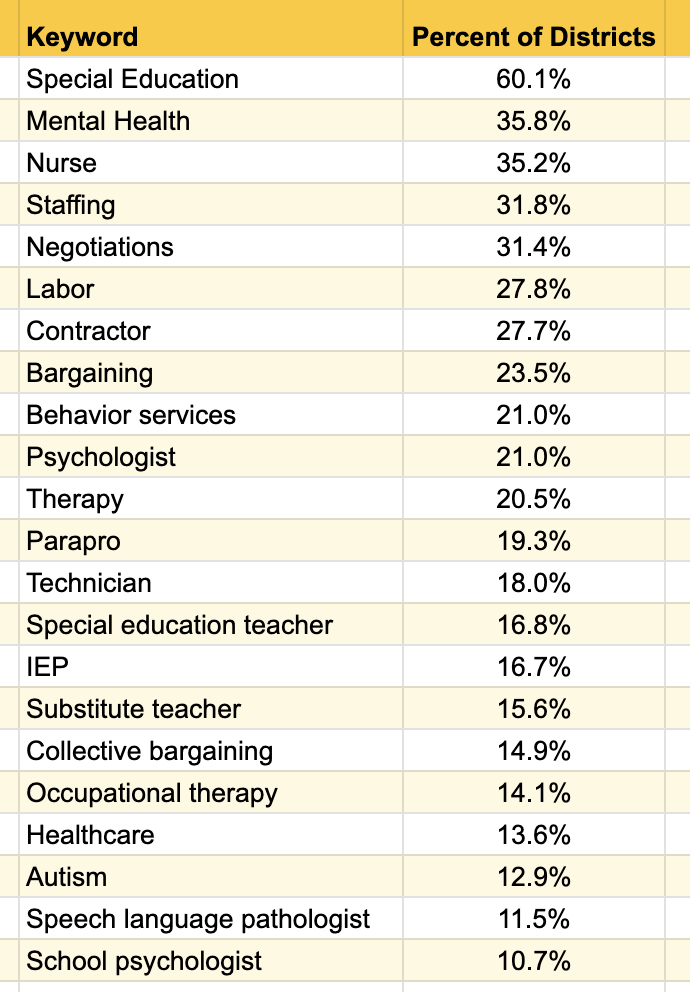
The chart below indicates the percentage of districts that mentioned a term at least once. If a district mentioned a term in multiple board meetings over the period, it only counts as one time in the percentage.
Special education and mental health are the most widely mentioned terms, but note that highly specific terms such as autism, collective bargaining, and occupational therapy make frequent appearances:
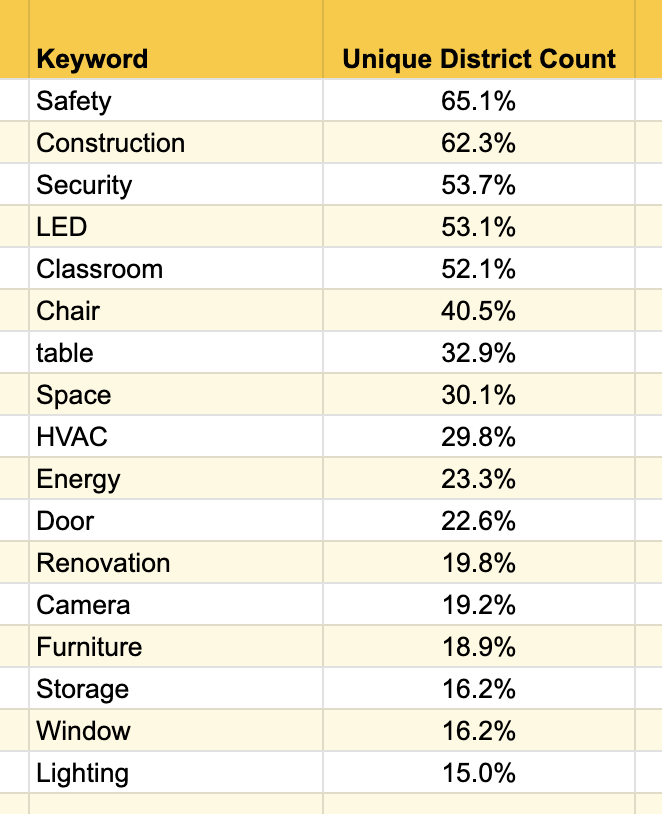
Below is a chart featuring a variety of terms relating to construction, renovation, and air quality. Board discussions frequently reference initiatives in the planning and consideration phase, and also cover approval of finalized contracts from these categories:
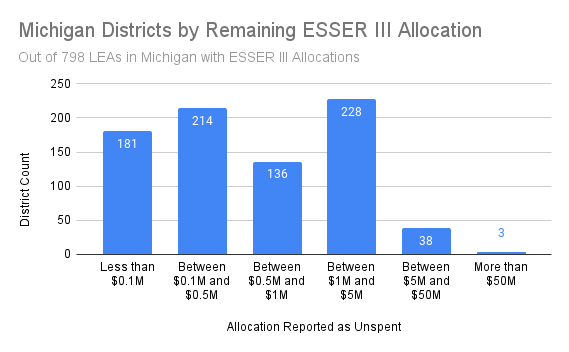
2. Burbio is the only source of detailed ESSER III plans, having transcribed over $90 billion of spending, and we also track ESSER III percent-spent by district. This week we look at Michigan's ESSER III spending based on recent reporting from September 1st. Statewide, districts have spent 54% of funding and have just over $1.5 billion remaining. The chart below shows the amount of funding remaining by district. Thirty-eight districts have between $5MM and $50MM remaining with three having over $50MM remaining:
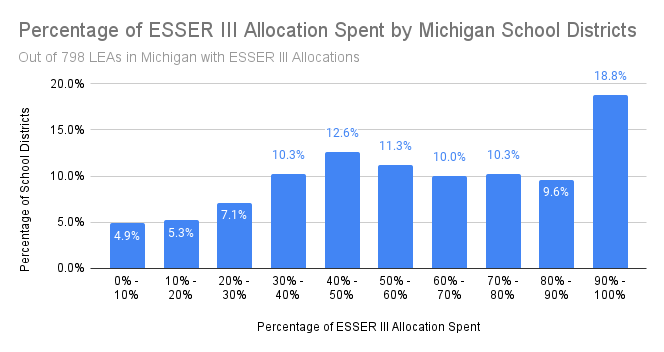
Below is a breakout by decile showing the percent of allocation spent by districts:
3. Pennsylvania is one of a handful of states that publish timely summaries of K-12 school budgets and they just published their 2023/24 figures. Given the state is the fifth largest in population with a healthy mix of district types this allows for interesting comparisons. For the analysis below we used districts that Pennsylvania disclosed for both the coming FY 24 year, and the previous FY 23 year. That ended up being exactly 700 districts that cover 83.9% of Pennsylvania's K-12 population.
Spending is increasing 5.1% year over year, with an absolute FY 24 total of $33.392 billion versus $31.694 billion in FY 23 for these districts.
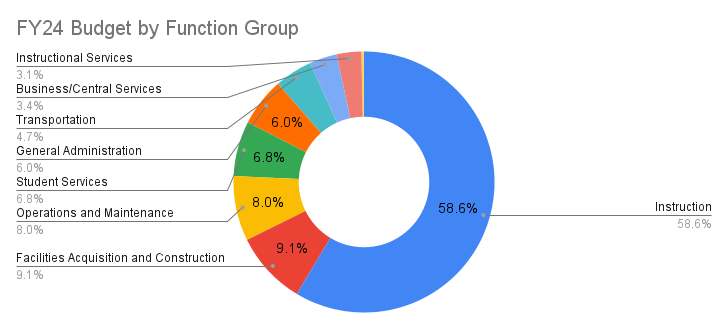
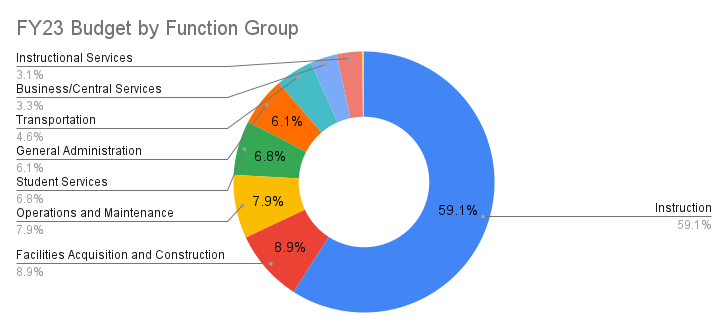
School operating budgets are typically broken out in two different ways, by "function" and/or by "object.” "Function" categories explain the purpose of the spending while "object" categories explain what the money is being spent on.
Below is a chart of the function categories in the Pennsylvania budgets for FY 24 and FY 23. The percent spent on instruction is 58.6% for the coming year versus 59.1% last year (FY 24 pie chart is on top, FY 23 chart below) :
It is worth noting that instruction did increase in absolute terms; absolute dollar spending (not shown above) is going up by 4.1%, but since it's less than the aggregate increase of 5.1% its percentage of the "pie" drops.
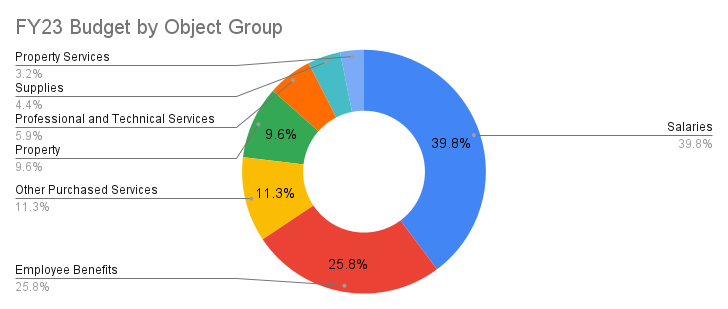
4. Below is a breakout of the same figures by object (what the money is being spent on). Salary and Employee Benefits combined dropped slightly as a percentage of the pie this coming year, while "Other Purchased Services," "Property Services," and "Professional and Technical Services" all increased. For perspective, "Other Purchased Services" for this group of PA districts totals $3.8 billion in FY 24.