1. Burbio's School Board Meeting Tracker covers school board meetings representing over 60% of the PreK-12 school population.
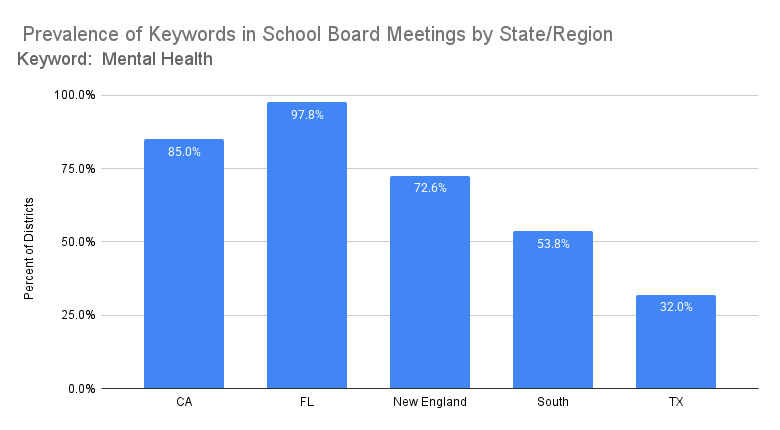
This week we explore how district discussions (over the 12 month period ending September 2024) differ across geographies. In the charts below there are five geographies featured: California, Florida, and Texas, plus a bundling of New England states (CT, MA, VT, NH, RI, ME), and southern states (AL, MS, NC, TN, SC). Districts surveyed cover well over half the K-12 population in each geography, with the exception of New England, where the reporting covers just under half. The charts below represent the percentage of districts that mentioned the terms at least once during the period.
Our first reference is chronic absenteeism, discussed at a much higher frequency in California and New England: 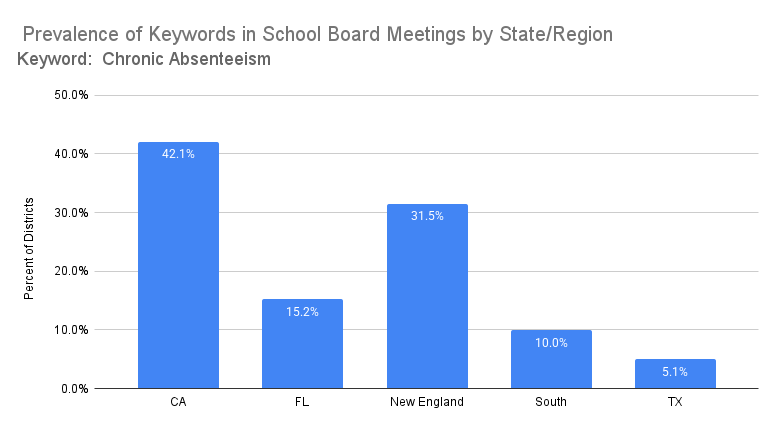
The difference in mental health is less pronounced among regions, with it being a regular feature of Florida school board meeting discussions:
There continues to be a regional difference in the frequency with which SEL and related terms appear: 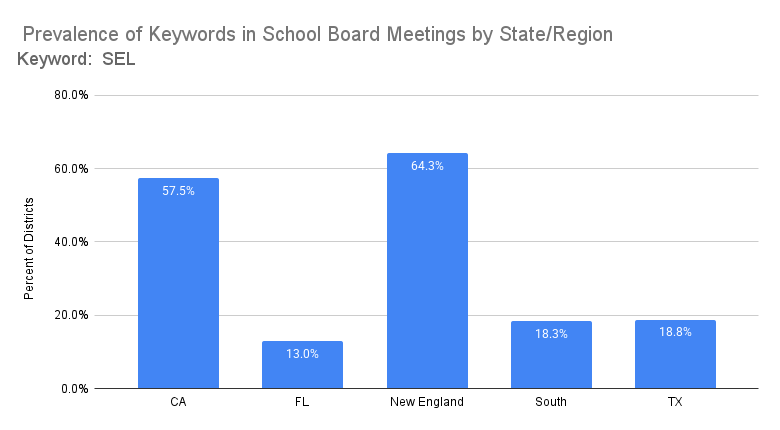
Clients use school board meeting minutes in addition to Burbio's other PreK-12 spending and strategy datasets (state grants, bonds, checkbook registers, and more) to understand district objectives and use that information to proactively engage with districts before they begin an RFP process.
2. With the recent U.S. Department of Education initiative targeting DEI programs at the Federal level, we wanted to take a look at the use of the terminology across PreK-12 Education. The terms DEI, equity, diversity, and inclusion are widely used and appear in job titles, district mission statements, academic courses, district and community-led committees, statements by community leaders and school board members, and more.
The following chart shows the percent of school board meetings that reference each term at least once during the quarter identified: 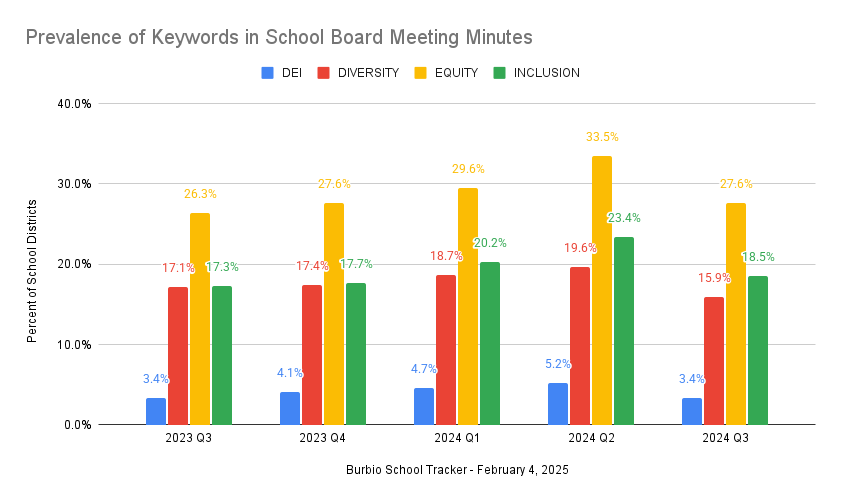
In Q3, which covers July through September, districts tend to have slightly less board meetings due to summer break, and that explains the lower numbers during that period.
Districts also reference these terms in strategic plans. Burbio's database consists of over 3,000 strategic plans and LCAPs covering over 70% of PreK-12 students. We included just references to "equity" and "diversity" below, as we found that the term "inclusion" was too-often appearing in an administrative sense in strategic plans (unlike board meetings, where "inclusion" was almost universally used in an educational context).
Our first chart shows references in strategic plans since 2020 to the terms DEI, equity, and diversity, outside of California, which is listed further below: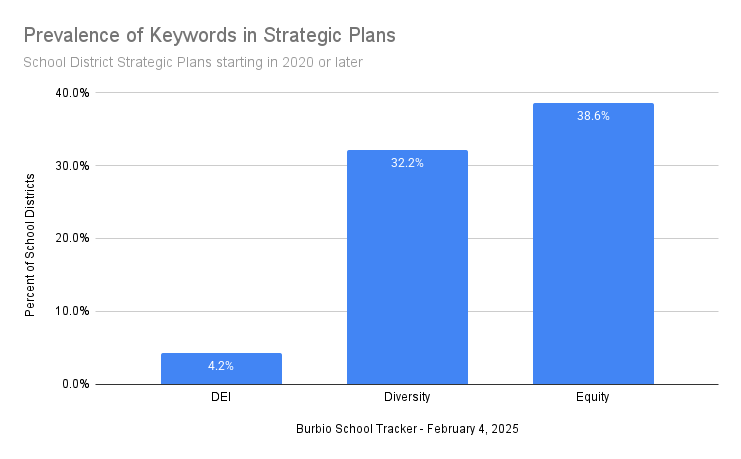
California districts have a unique, highly detailed reporting requirement called "Local Control and Accountability Plans" (LCAPs), issued annually, that run over 100 pages and include spending and policy details for the upcoming year. These include more frequent references to all terminology relative to plans in other states so we break them out. The term equity is used almost universally in LCAPs, appearing as many as 40 to 50 times in some documents: 
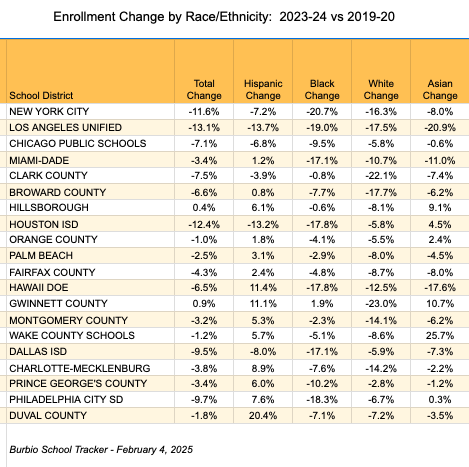
3. In late December NCES (National Center for Education Statistics) published their enrollments for the 2023-24 school year. This week we look at the shift in the ethnic makeup of the 20 largest school districts versus 2019-20, the year before Covid-related school disruptions.
The first column indicates the total change in enrollment, and the next four the relative change for the respective ethnic group versus the comparison period.
- In 18 of the 20 districts, the Hispanic population change is a higher figure - meaning enrollment either slowed less, or grew faster - than the change since 2019-20.
- Conversely, in 17 of the 20 districts, the percentage of Blacks dropped faster - or increased more slowly - than the overall change.
- In 15 of the 20 districts the percentage of White students dropped faster, or increased more slowly, than the change since 2019-20.