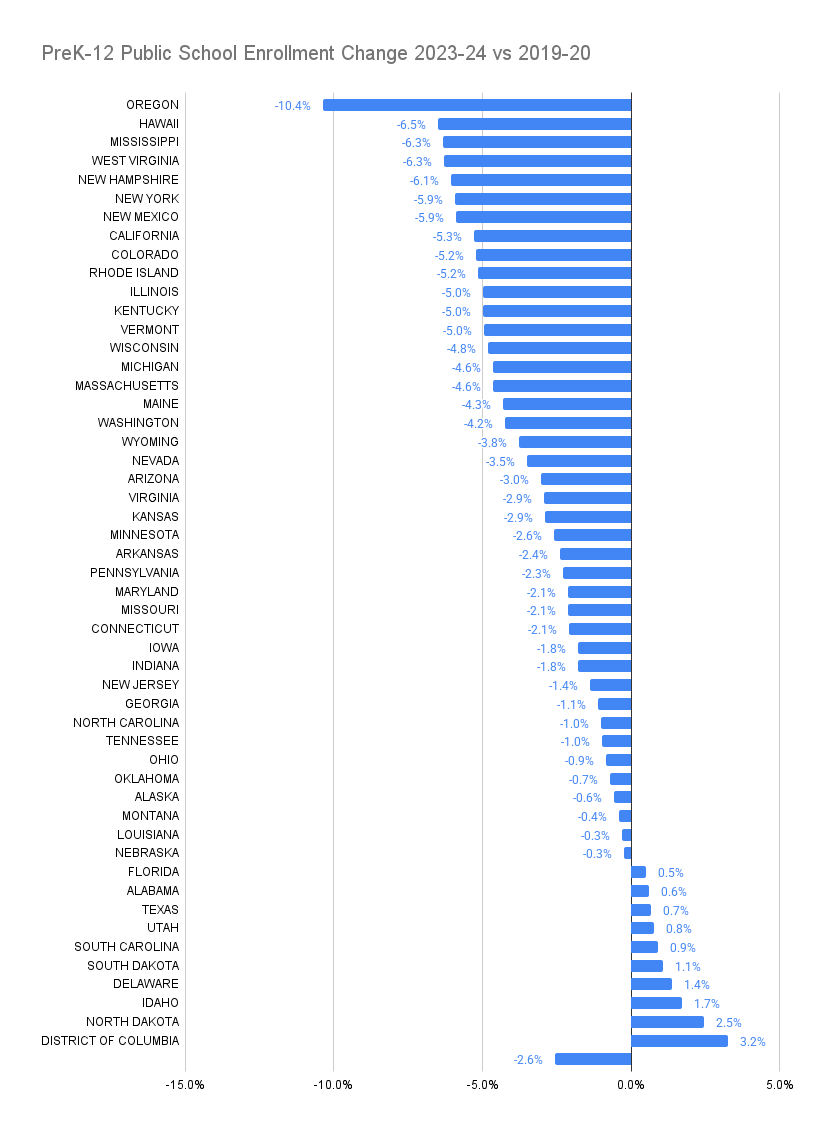
1. Late last month NCES (National Center for Education Statistics) published their enrollments for the 2023-24 school year. Below is a list of the enrollment change versus 2019/20 (the year before Covid-19 disrupted in-person education) of all 50 states plus the District of Columbia. The overall decline across the period is 2.6%: 
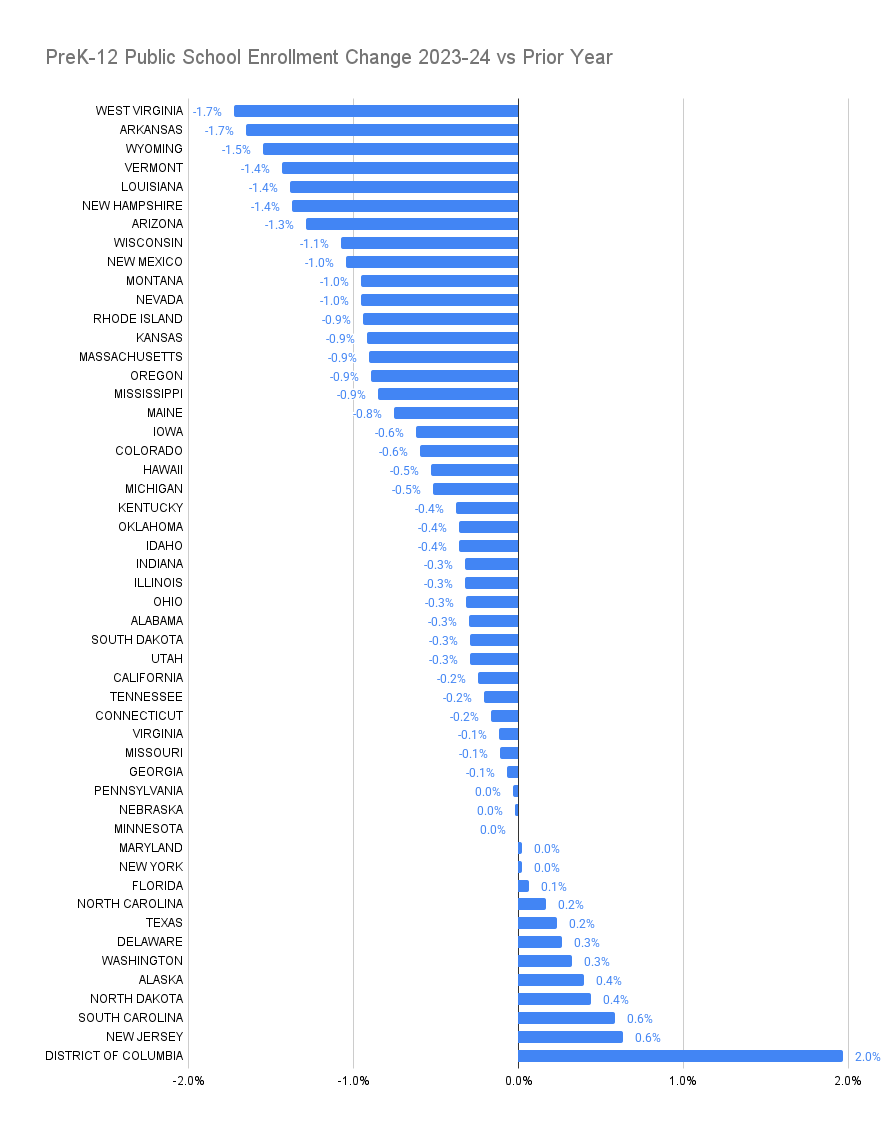
It is important to note that NCES figures can differ slightly from those that the states report themselves due to differing methodologies. At the bottom of this email we show the state-by-state change versus 2022-23, which featured a national decline of 0.2%.
2. Later this month Burbio is adding school bond data to our PreK-12 Intelligence Hub, which currently features state grants, school board meeting minutes, strategic plans, checkbook registers, superintendent turnover, and capex and operating budgets.
School bond information will be available via a sortable dashboard, a searchable keyword map, and as part of each District Profile. Our bond dataset features such elements as bond amount, coverage summary, vote date, approval status, document links, and more.
The largest spending categories of school bonds include areas such as construction, HVAC, energy efficiency, playgrounds, athletic fields, furniture, and equipment. As we launch the dataset we want to highlight some additional areas of spending that have material impact for key verticals in the industry:
- STEM: Among many examples, Lake Mills Area School District, WI, is renovating space for STEM programming as part of their $51 million bond, Arlington Central School District, NY, will be adding science labs, STEM rooms, and library media centers as part of their $179 million bond, and Cranford Public Schools, NJ has a new STEAM lab included in their $75 million bond.
- CTE: Maricopa Unified School District, AZ, will be spending over $20 million on a workforce development expansion, Cranston, RI will be spending $13.9 million to purchase, renovate, furnish, and equip the Cranston Apprenticeship Exploration School, and Crestwood School District, MI will build a new Career and Technical Education Center as part of a $121 million bond.
- Security: Cherry Creek School District, CO, passed a $950 million bond that includes an array of security upgrades, while Indian Prairie School District, IL will be investing in security cameras, vestibule improvements, fire protection systems, access control, and more as part of a $420 million bond.
- The Arts: Highland Park ISD, TX, passed a $137 million bond that includes band and orchestra equipment and uniform replacement, while School District Five of Lexington & Richland Counties, SC, includes a fine arts auditorium in their $240 million bond.
Clients will receive customized alerts, and be able to view bond data on a customized district profile that combines the data with all other district level documents and can be easily integrated into CRM systems. Having all this information in one place gives a complete picture of district planning and spending priorities.
3. The most important individual in setting district policy is the district Superintendent, and Burbio's Superintendent Turnover Tracker measures changes in that role nationwide and provides alerts when openings occur. Tracking includes:
- Identification of change in district leadership immediately upon the resignation or termination of the previous Superintendent.
- Documentation of status of searches, start dates of new Superintendents, and monitoring where the new Superintendent used to work and what district the outgoing Superintendent left to lead (if any).
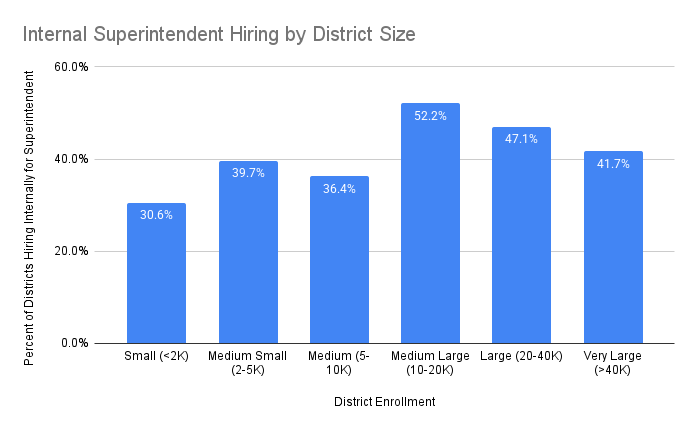
This week we examine the percentage of districts that hire internal candidates broken down by district size. This analysis covers over 600 districts that have replaced their Superintendents since announcing openings going back just over a year. Counts in the size categories range from a low of 36 districts (Very Large) to well over 100 searches for the Small, Medium Small, and Medium Districts.
Internal candidates are hired at a rate that ranges from 30.6% to 52.2%, with the highest percentages in the larger districts. Across all 600+ districts the average was just under 40%: 
4. Below is a chart showing state-by-state enrollment changes versus last year. National enrollment decline was 0.2%:
