This week we take a deep dive into public school enrollment by charting trends according to "Locale Classification" as well as trends by grade, both nationally and showing some example states. We also take at a look at some of the more specific re-engagement programs being put in place by Districts using ESSER III funds.
Burbio's ESSER III dataset now consists of over 3,900 districts with over $74 billion of allocations and representing 65% of US K-12 enrollment. To receive a sample dataset of 125 districts that have been allocated over $3 billion
sign up at our ESSER III page.
If you were forwarded this email and would like to receive it weekly, sign up
here.
1. This week we take a deeper dive into public school enrollment in 2021/22 versus 2020/21. Burbio has currently collected enrollment data that compares those two years from 41 states plus the District of Columbia, representing just over 75% of US public school enrollment. A few points of background:
- The National Center for Education Statistics (NCES) classifies school districts into four major locale classifications based on the type of area where a school is located: City, Suburban, Town, Rural. We have been able to roll up and compare enrollment trends at the national and state level based on those classifications for the 41 states we have aggregated.
- Burbio has grade-level enrollment comparisons from 34 of those 41 states, and we have rolled up that data to the national level for those figures.
- We also can look at locale classification trends at the state level, and grade-level enrollment trends as well where available.
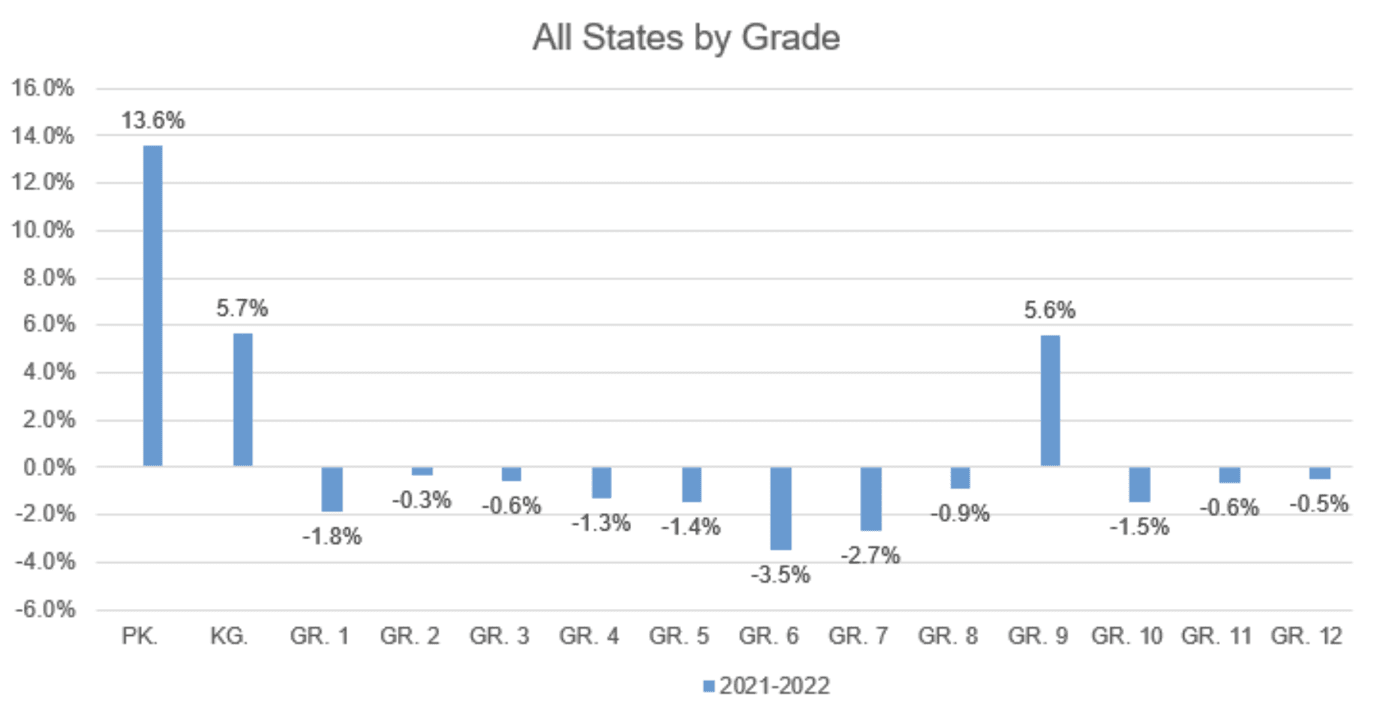
2. Our first look is at the national data:
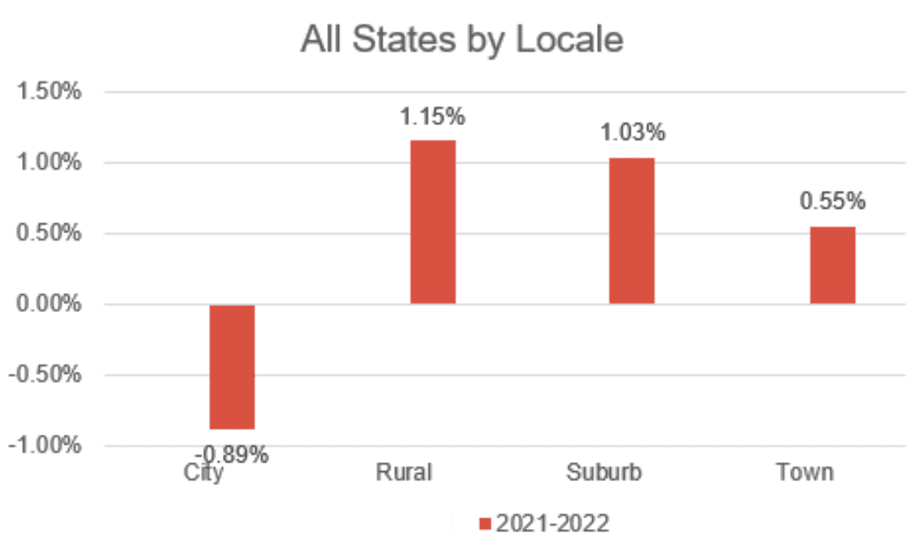
- This chart shows national trends for locale. City districts lost enrollment, and the other three locales all grew:
 |
- Below is a comparison of enrollment by grade level. There is large enrollment growth in Pre-K, Kindergarten, and Grade 9, with a decline in all other grades.
3. We now jump into state-by-state analysis to see if the national pattern plays out more locally. We found many states with directional patterns similar to national trends and below we show a mix of state examples.
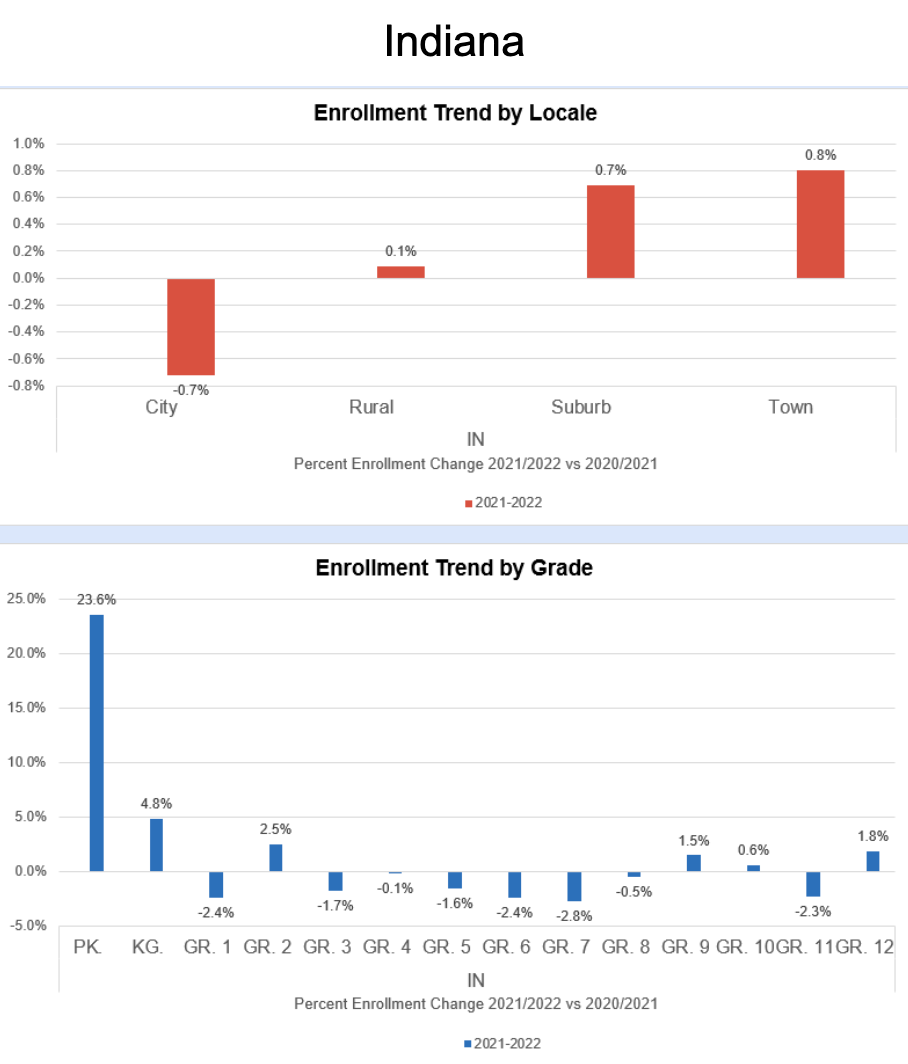
- In Indiana, where total enrollment grew 0.3% from 2020/21 to 2021/22, you will note the locale trend is consistent with the national trend. Pre-K and K had the largest enrollment increases, and three other grades besides Grade 9 had enrollment increases.
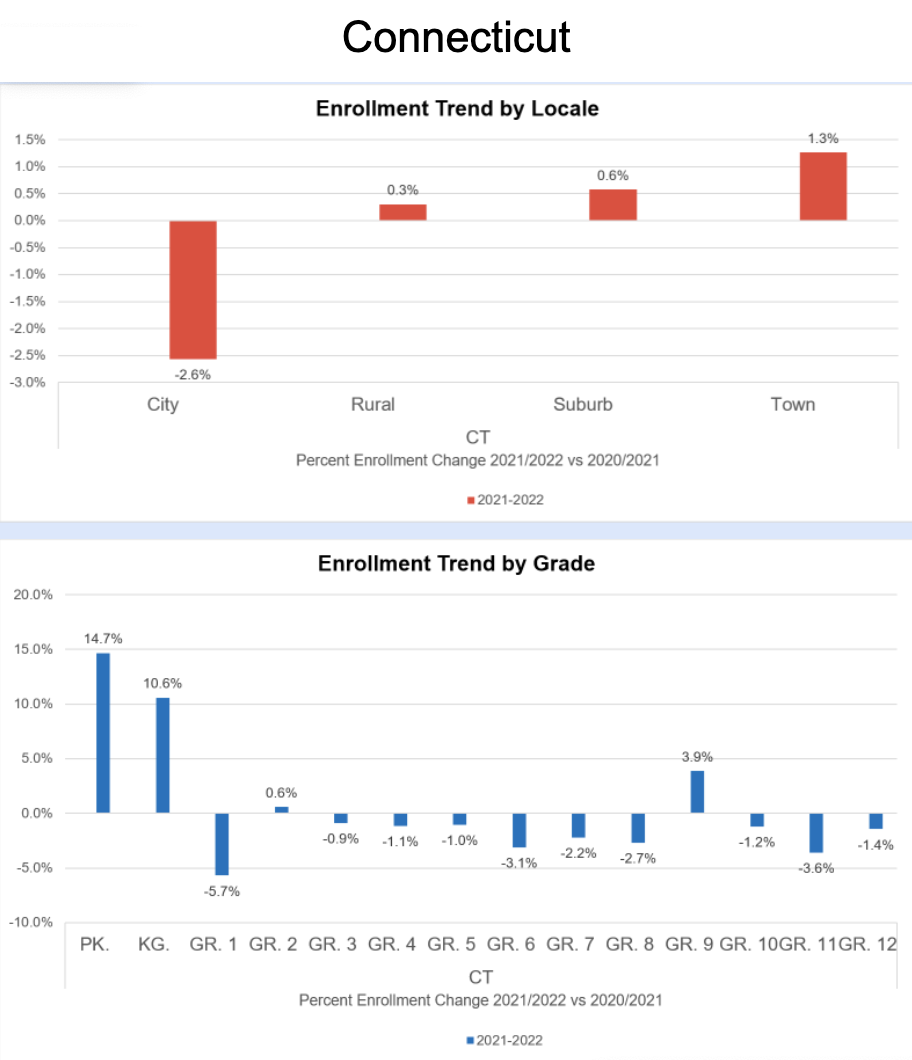
- Connecticut's enrollment grew by 0.1% during the comparison periods. The locale trend is consistent with the national trend, and the grade-level trend matches it closely, with Pre-K, Kindergarten and Grade 9 increasing the most and a slight increase in Grade 2.
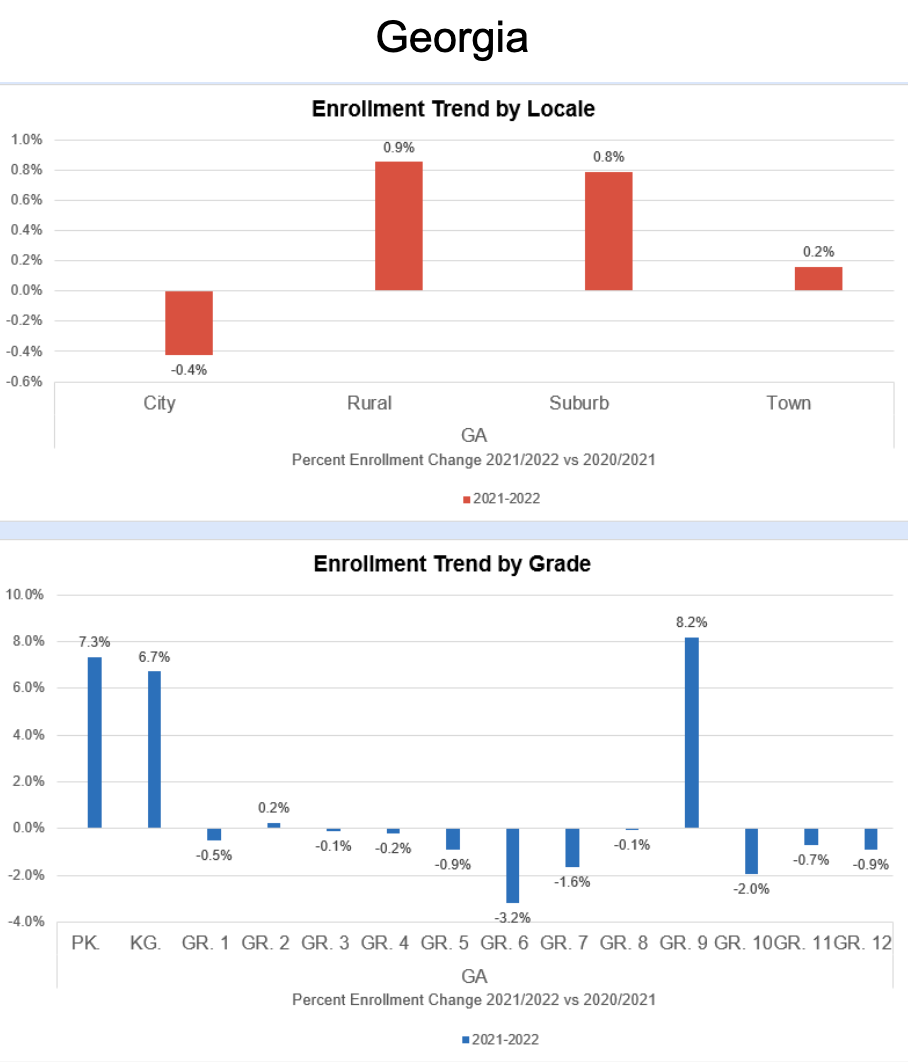
- Georgia had a 0.6% increase in enrollment. The "increase/decrease" trends for locale, and the grade-level changes, were consistent with the national pattern.
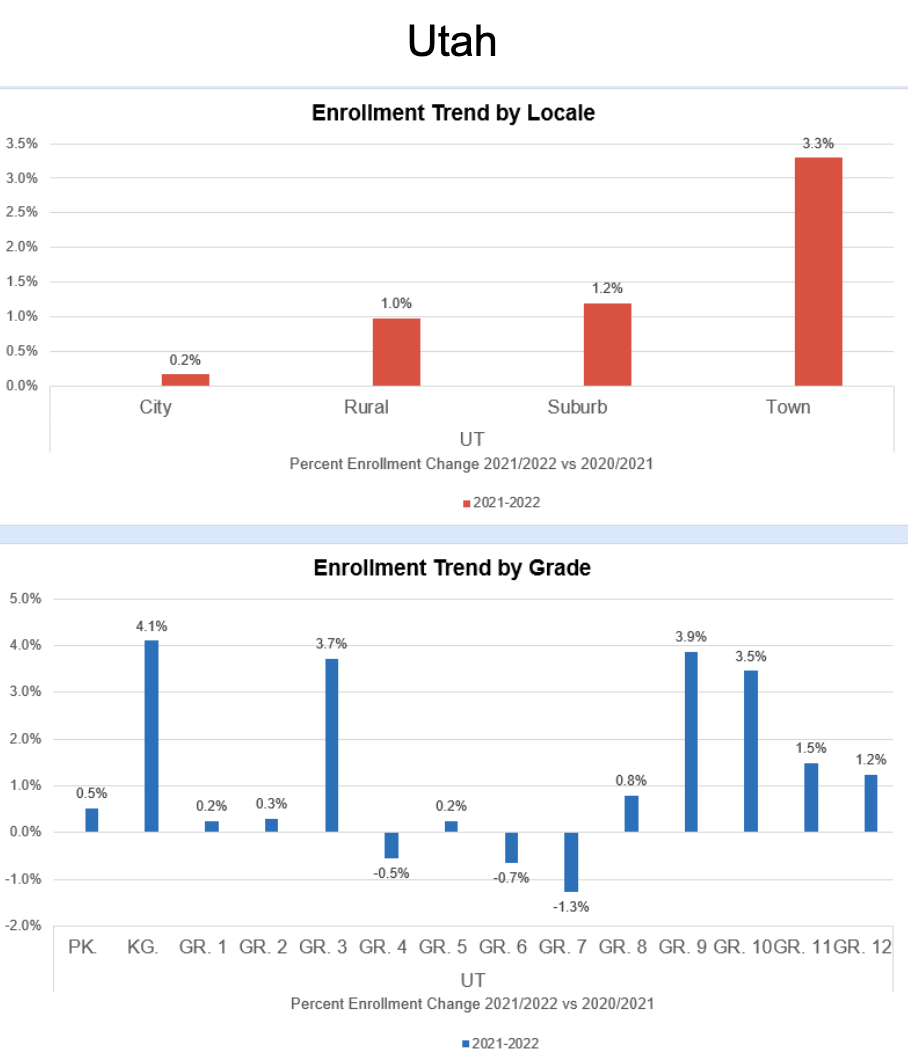
- Utah's enrollment grew by 1.3% For this state, all the locales increased, with the "City" increase being the smallest. Grade level patterns were a bit different than national, but with large increases in Pre-K/K and Grade 9 in the figures.
- In our final example, Michigan had a 0.4% increase in enrollment. The "Town" category (which has the smallest increase of the non-City locales at the national level) declined along with the City districts. Michigan doesn't track Pre-K enrollments, but again there is an increase in kindergarten and ninth grade.
Burbio integrates this data at the district level into our business intelligence services for clients. We will continue updating this information as more reporting becomes available.
4. This week we wanted to highlight the different ways districts are re-engaging with students using ESSER III funds. The figure in parenthesis is the district's total ESSER III allocation:
- Fort Worth ISD, TX ($262MM) will be adding 107 full time family engagement specialists at all elementary and middle schools whose responsibilities will include "attendance monitoring, customer service (welcoming school environment), volunteer management, social media management, social emotional learning support and crisis intervention, parent advocacy, site based decision making and understanding assessment data."
- Guilford County School, NC ($198MM), which reports an enrollment drop from 73,321 in 2017/18 to 70,227 in 2020/21, gives details on their plans: "Employ public relations firm to assist with PK marketing to increase enrollment - Student and family community liaisons and college transition counselors to support students who need support with attendance/engagement - Weekly student level Canvas reporting tools and dashboards for schools to identify students who need support . . . Counselor and social worker training sessions for utilizing data sources . . . Weekly logs to track services for Students with Disabilities and English Learners - Student support committees . . . . Attendance campaign through partnership with Attendance Works . . "
- Allentown School District, PA ($88MM) outlines multiple approaches: "Hire Learning Loss Attendance Support Specialists to work closely with attendance teams and assist schools with attendance intervention/strategies to improve attendance using school specific attendance data analysis and evidence-based strategy planning to . . . . encourage re-engagement and reduce truancy and learning loss;" "Hire Community Aides to visit and communicate with families, encourage engagement, align families with the necessary staff/support and verify residency;" "Offer the Continuum of services/supports for students and families experiencing homelessness;" and "Implement Attendance Outreach Initiatives, such as our Attendance Outreach Campaign, to re-engage students who are chronically absent." . .
- District of Columbia Public Schools, Washington, DC ($193MM) outlines a wide variety of engagement-related policies in their Continuous Education plan for this current year. Among several initiatives outlined, we noted the following: 1) A "Confidence Campaign" featuring school level outreach and engagement, a digital content and storytelling strategy to reach stakeholders, and health and education delivered both virtually and in-person to address questions and concerns. 2) Ongoing two-way communication objectives with parents with regard to their students' progress activated at the school level 3) Outreach to students who were disengaged from virtual learning as well as chronically absent "from school-based attendance counselors, teachers, school leaders, DCPS Central Services, and from external partners like Child and Family Services Agency (CFSA) when necessary. DCPS updated our unexcused absence notification process to include a wellness call after three days of unexcused absences."
- Marlboro County School District, SC ($19.9MM) will implement the following: 1) Care closets will be placed in each school to provide students unable to meet, or have limited access to, such basic needs as toiletries and clothing. 2) Implementation of an evening program offering classes for high school graduation and/or GED, targeted to students who have entered the workforce. 3) Fifteen "Living Learning Resource Centers" will be established around the County located in churches, community centers, and housing authorities. "The project will include the purchase of computers, furniture, carpet and paint."
- Granite School District, UT ($97.5MM) will spend $500,000 on "Student attendance supports and initiatives to improve daily attendance" with a goal to "return (to) or exceed" pre-Covid 19 attendance levels. In addition, in an area of support we see in many plans, the district will spend $1MM on "Improved parent engagement initiatives so parents know how they can effectively support their student(s);" metrics to be measured for success of this initiative include the "number of parents monitoring grades, attending school events, volunteering, etc." and the percent of parents setting up an account in the parent portal.
- Hamilton County Schools, TN ($91MM) will allocate "Funds for Literacy Community Events to educate families and communities on Foundational Literacy Skills and to provide at-home literacy resources. Truancy Specialists will work with students, families, and the school to ensure students are at school and not truant. Mobile classrooms, Family Resource Specialist and advanced messaging services" will also be deployed.