1. Burbio's
School Budget Tracker documents detailed budget spending. In
last week's blog we reviewed districts facing enrollment declines, and this week we review districts where enrollment is increasing. What we have found is that even where the trajectory of enrollment is up, there was a decline in enrollment during 2020/21. In some districts enrollment continues to trail pre-Covid-19 levels even as it bounced back slightly in 2021/22, and in others enrollment has now surpassed the 2019/20 school year. Below are examples of each type.
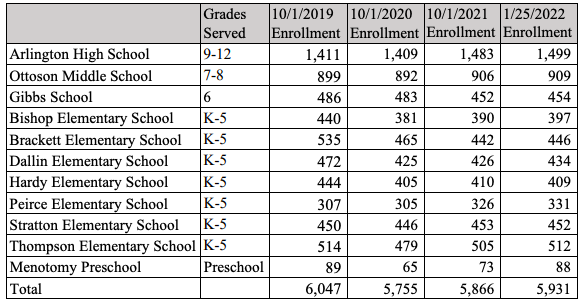
Arlington Public Schools, MA enrollment dropped during 2020/21 but resumed growth this past year, although not to pre-pandemic levels. From the district budget:
"Arlington Public Schools enrollment had been climbing from 2012‐2020 . . . . . for the 2020-21 school year, Arlington, like many districts nationwide, (saw) deleterious effect on enrollment," reads the document. The district is assuming enrollment growth will resume, but does discuss in detail the various assumptions ( ". . . . many students who opted out of public education due to COVID-19 will return to schools over time as the health threat subsides") beyond local demographics that the district is considering.
Gwinnett County Public Schools, GA enrollment was growing heading into FY 21, dropped 1.8% in FY 21, and rebounded 1.2% in FY 22. The district is projecting a 1.8% enrollment increase next year, to a level above FY 2020 and then growth in the 0.4% to 0.6% range in future years.
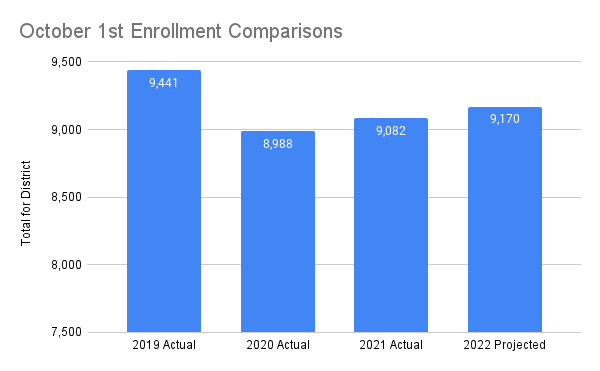
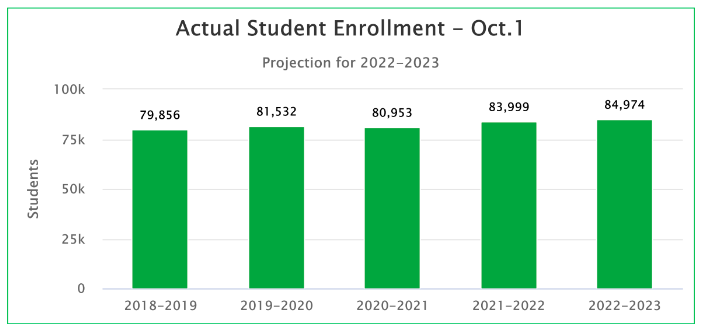
Greater Albany Public Schools, OR presents a chart with enrollment as of October 1st of the given academic year. Enrollment dropped 4.8% for the 2020/21 academic year, and grew very slightly (0.1%) during 2021/22, below the 2019-20 figures. The district is presenting similarly small growth next year.
Now some districts that have bounced back past pre-Covid 19 levels. Cypress-Fairbanks ISD, TX's enrollment grew every year from 2015/16 to 2019/20 before falling 1.4% in 2020/21. Enrollment grew to just above 2019-20 pre-Covid 19 levels in 2022 and the district is projecting growth rates of 0.7% to 1% in the future years.
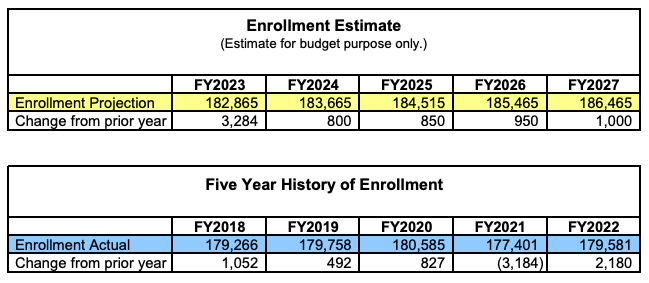
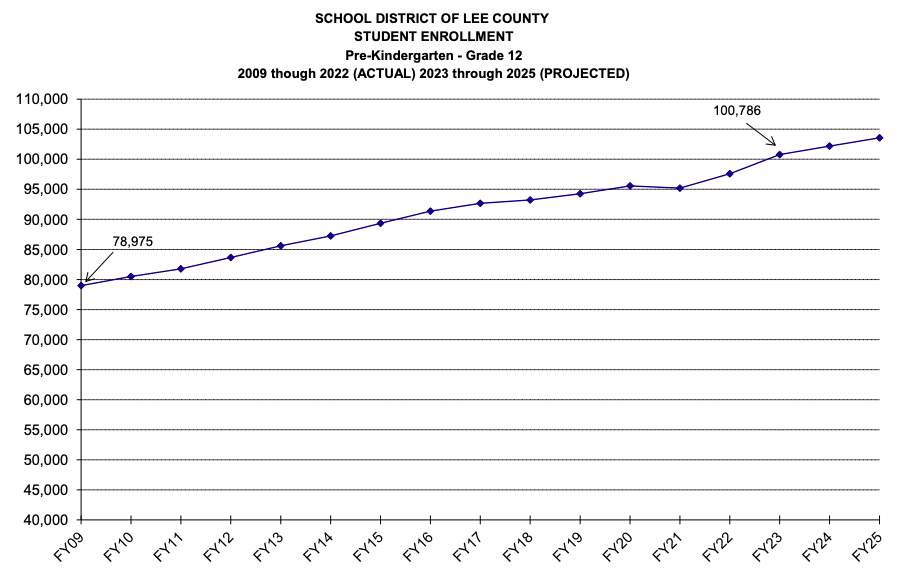
The School District of Lee County, FL's enrollment grew over 20% from FY 09 (78,975) to FY 20 (95,578) before dropping to 95,211 in FY 21. Enrollment increased above FY 20 levels to 97,579 in FY 22 and the district is forecasting 3.3% growth in FY 23.
Alpine School District, UT had a 0.7% decrease during 2020/21 after increasing the previous year. Enrollment jumped 4.2% in 2021/22 to above pre-2019-20 levels and the district projects continued growth next year:
2. As has been widely reported, the recently released
"Nation's Report Card" assessments revealed declines in reading and math scores for age 9 students from two years ago. Burbio researchers have begun to see districts discuss their own performance against state-level testing, often comparing themselves to other districts in the state or citing improvements from the recent 2020-21 year but staying silent on comparisons to 2019-20. State level summaries, however, provide a clearer picture of the decline since before Covid-19 and they are consistent with the national trend.
From North Carolina, the chart below
can be found at the state's testing dashboard and represents "North Carolina End-of-Grade and End of Course Reading, Mathematics, and Science Assessment Results. It reflects students testing proficient from 2016/17 through 2021/22 with no data in 2019/20 due to Covid." The figure below are "all students" and can be toggled by gender and ethnicity:
In South Carolina, in the
state's release on their assessment results the State Superintendent is quoted, “We are alarmed and very concerned about the regression we see in areas like math, while encouraged by what we see in ELA. Much more will need to be done . . ." Below is a chart showing the math results and the decline from 2018-19 across grades. The
link to the release has the ELA scores as well, which as noted are close to the 2018-19 results.
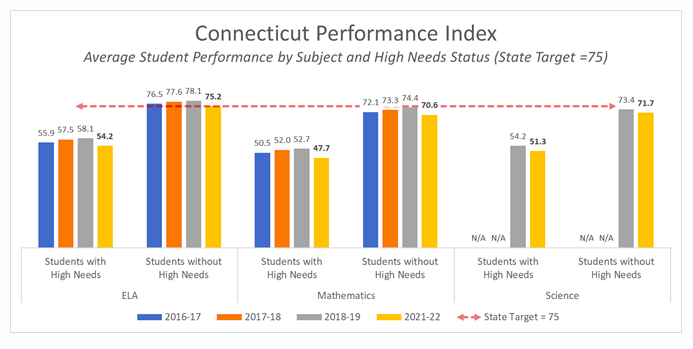
This release from Connecticut on their state results notes, "The Performance Index - the best measure of overall average achievement in a content area – shows that while achievement was increasing prior to the pandemic, the achievement in 2021-22 is still below the three most recent pre-pandemic years." Below is the chart; note the yellow bar is the most recent year, and the gray is 2018/19: