1. In addition to details on over $90 billion of ESSER III planned spending, Burbio's
School Budget Tracker consists of a growing database of 2022/23 K-12 school budgets featuring detailed spending by districts. Later this month we will ship our partners a breakdown of 1,700 operating budgets and over 300 CapEx budgets that cover over $200 billion of spending. We are adding billions of dollars of spending to this dataset daily.
The current size of the dataset allows us to start examining trends. Going forward we will be doing periodic budget analysis along with our continuing work on K-12 enrollment, federal stimulus spending, and school operations and schedules, and at times combining this data for analysis.
District budgets are often highly detailed and thus our spending categorizations are very granular, but they can also be rolled up to see higher level patterns. This week we focus on one state, Pennsylvania, and look at higher level trends there. Our analysis includes every K-12 school budget for the state of Pennsylvania except for Pittsburgh. (It's the sort of thing that happens in gathering data, sometimes you can't get it all as fast as you want!) Pittsburgh only makes up 1.3% of K-12 enrollment in the state so we believe the figures below are illustrative.
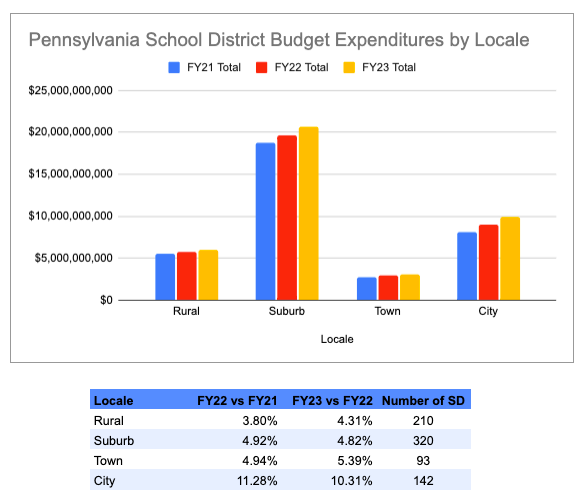
The first chart is expenditure growth by district type. K-12 budget expenditures for Pennsylvania school districts went up 6.2% from 2020/21 to 2021/22, and are projected to go up by 6.1% from 2021/22 to 2022/23. The chart below shows the cumulative spending for districts in the state by
NCES locale classifications. Note many charter schools are classified as districts, and are often in cities, and the city count does include those figures. Below the chart is the percentage growth for the different locales. Note that city districts increased by double digits each of the last two years.
 |
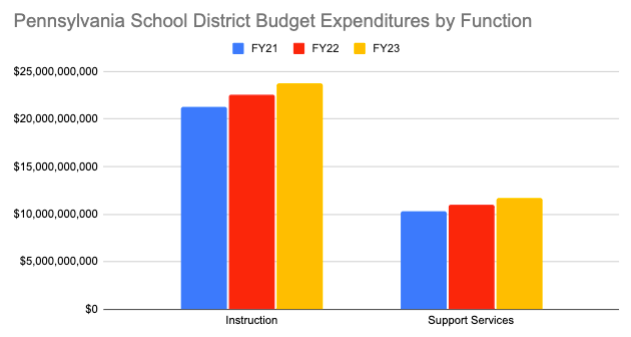
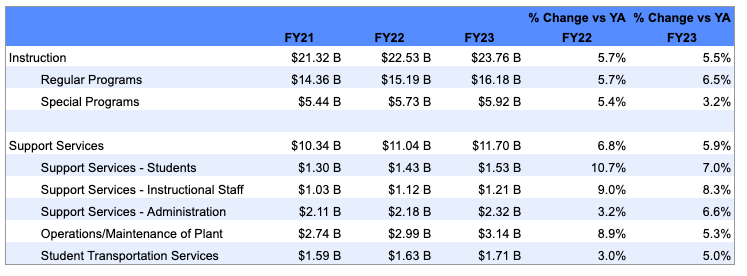
2. School operating budgets are typically broken out in two different ways, by "function" and/or by "object". Function categories explain the purpose of the spending while object categories explain what the money is being spent on. Below is a chart of the two function categories in the Pennsylvania budgets -instruction and support services. Below the chart is a break out of the largest sub-categories within those major categories.
Note support services grew slightly faster than instruction, and support services for staff, students and administrators grew faster than other support service components.
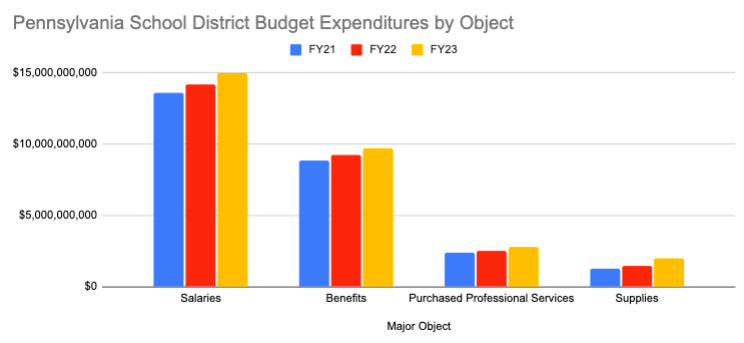
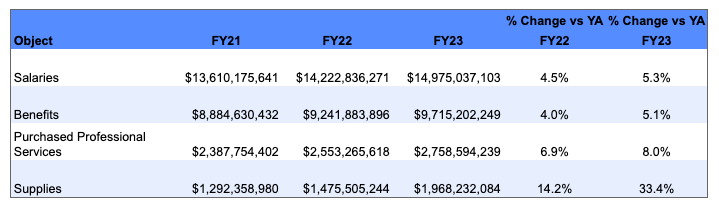
3. Below is a chart showing the largest object categories. Staff salaries and benefits are traditionally the largest expenditures for school districts. Note the percentage growth in supplies projected for the coming year: