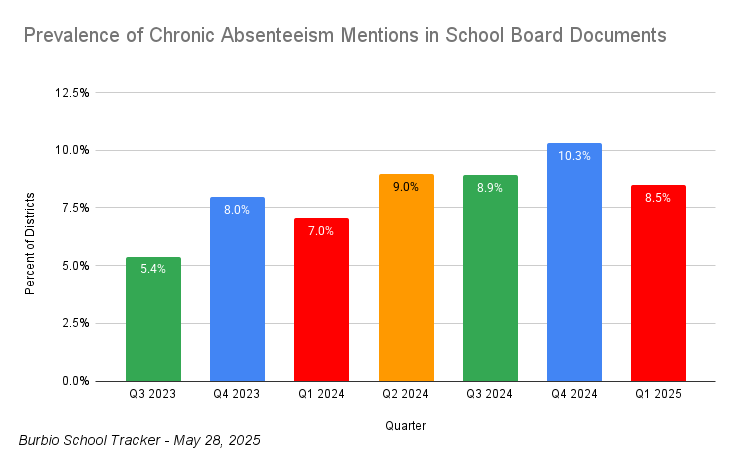
1. We begin with a look at chronic absenteeism discussions in board meetings through both keyword mentions and our Signals Tracker. Below is a chart of mentions of the term chronic absenteeism. Figures below represent the percent of districts that mentioned the term at least once in the quarter.
Chronic absenteeism is discussed more frequently during different times of the school year - for example peaking in Q4 when early attendance patterns and enrollment counts occur - so year-over-year comparisons are the best way to view the figures below. Discussion has risen over the past 18 months:
- Mentions of chronic absenteeism were 8.5% in Q1 2025 versus 7% in Q1 2024 (red bars)
- Mentions were 10.3% in Q4 2024 versus 8% in Q4 2023 (blue bars)
- Mentions were 8.9% in Q3 2024 versus 5.4% in Q3 2023 (green bars)
We used Burbio's Signals Tracker to identify discussions of chronic absenteeism from the last few weeks:
- Humboldt County School District, WV has seen a drop in chronic absenteeism recently and discussed engagement tools being used such as writing projects, intramurals, clubs, and an attendance board.
- Richland School District, WA includes attendance monitoring as part of their on-time graduation initiative. "Being on track to graduate at the end of ninth grade is a stronger indicator of future graduation than race, ethnicity, poverty or test scores," notes the the report.
- Lockport Township High School District 205, IL discussed absenteeism in the context of student behavior. "Our Student Support Teams (SST) continue to meet regularly to identify students who are in or may be in need of additional support . . . Deans continue to address chronic absenteeism by taking all of the necessary action steps, including making home visits."
- Copenhagen Central School District, NY discusses ongoing efforts to address chronic absenteeism, "Letters continue to go home to parents of students at the different steps of our attendance policy. Excessive tardy and excessive absence meetings are held as appropriate . . ."
2. Burbio's foundational school district dataset spans millions of pages of documents, and we recently rolled out our AI-powered Signals Tracker to deliver contextual answers. The Signals Tracker scores purchase cycle-related answers on a continuum from "preliminary consideration" through "completed implementation," with stages in between. The sweet spot for suppliers is to identify districts considering a need but who haven't yet selected their provider. A few notes:
- The timing of the "sweet spot" varies by industry vertical; in the capital equipment area, for example, lead times - the period from discussion to vendor decision - may be 1-2 years out, while other industry providers are on 6-12 month time frames.
- For categories where lead times are shorter, the window to act on the opportunity is tighter, as a district may announce an initiative and begin to select suppliers for consideration in as little as 60-90 days.
- For certain purchases, a larger district initiative can serve as a signal; for example an HVAC supplier will look at new school construction, an early childhood curriculum provider might focus on the creation or expansion of a PreK program, etc.
Some examples:
- Curriculum: Watertown Unified School District, WI is conducting a science curriculum review, with the reference that "new curriculum adoption will be brought to the board in the Spring of 2026." Rhinebeck Central School District, NY is undergoing a math curricula review process.
- Facilities: Westminster Public Schools, CO has a Facilities Initiative Committee looking at long term planning for the district, while Wayne County Schools, WV is determining facilities needs for a middle school.
- Program Creation: Penn-Harris Madison School Corporation, IN will be adding an Early Learning Academy to an elementary school next Fall.
- Security: Northville Public Schools, MI is going to be investigating an E-Hall pass system, with a plan to pilot some systems and select one for next year. Meanwhile Kanawha School District, WV is struggling with building security, noting, "The security detection thing is not doing what it's supposed to do . . . it's picking up too many things . . . " and that they will be looking at other options.
- Mental Health: Monroe County School District, FL has won a grant for $1 million, and included in purchases will be access to telehealth services.
A critical step in identifying opportunities is designing the prompt correctly. We continually iterate with clients to refine wording of the questions. For a customized demonstration of Burbio's Signals Tracker click here to schedule a meeting.
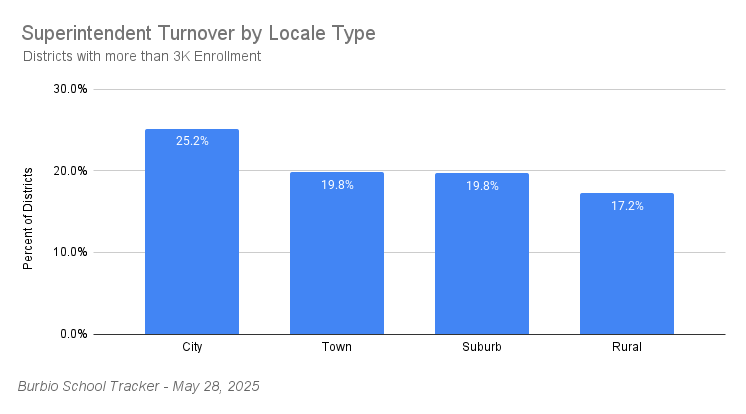
3. The most important individual in setting district policy is the district Superintendent, and Burbio's Superintendent Turnover Tracker measures changes in that role nationwide. This week we take a look at Superintendent Turnover by district locale. The chart below gives the percentage of school districts with more than 3,000 students who have experienced Superintendent turnover in the past year: