1. Burbio's State Information dashboard includes information such as state board meetings, budgets, Title I funds, enrollment trends, approved curriculums, and more. This resource also now includes links to state-level AI guidance, an area that is quickly evolving as states issue, update, and append these documents. Just over half the states have issued AI guidelines, and several of those have recently issued updates.
Across states, differences are not so much about policy but rather points of emphasis and level of detail around implementation. State AI policies generally cover these areas:
Ethics, Integrity & Responsible Use
- Academic Integrity: Addressing plagiarism, cheating, and redesigning assessments
- Ethical Standards: Equity, non-discrimination, privacy, and bias avoidance
- Transparency & Disclosure: Openly communicating when and how AI is used
AI Literacy, Learning, and Workforce Readiness
- AI Literacy for All: Building skills in ethics, bias awareness, data management, and critical thinking
- Teacher & Student Empowerment: Using AI as a “thought partner” for creativity and personalization
- Career Readiness: Emphasis on workforce alignment, framing AI as preparation for life and work in an AI-driven world
Implementation Frameworks & Governance
- Phased Rollouts and Guidance
- Leadership & Administrative Use: Using AI for planning, operations, and management
- Legal & Policy Compliance: Ensuring alignment with FERPA, COPPA, IDEA, CIPA
- Community & Stakeholder Engagement: Advisory groups, AI Alliances, town halls, parent notifications, and ongoing dialogue
Equity, Access, and Support Systems
- Accessibility Tools: Focus on inclusivity, equity, and tools for diverse learners
- Ensuring Equal Opportunities: Multilingual supports and disability accommodations, bridging rural-urban divides
Points of emphasis and the prescriptive nature of the guidance can vary. Some examples:
At Burbio, we are monitoring AI developments across all our datasets. AI impacts all facets of education from the mechanics of instruction and teacher preparation to school administrative tasks and operations, and we expect rapid iteration in both implementation and policy over the coming year.
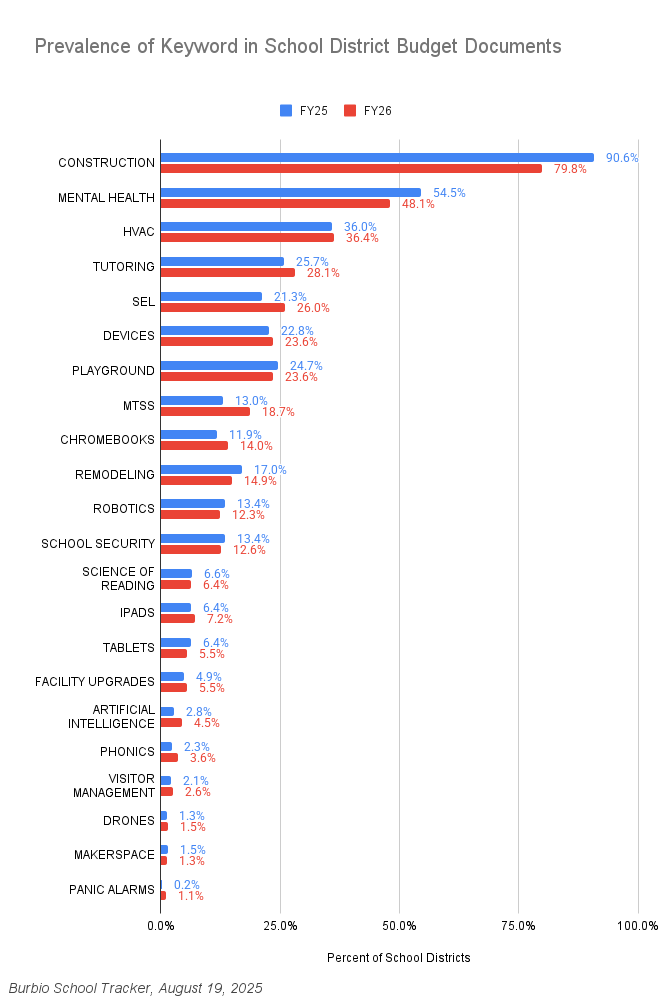
2. In addition to datasets such as state grants, board documents, bonds, and strategic plans, Burbio gathers PreK-12 school budgets. This week we do a keyword comparison between 470 districts covering 24% of K-12 students. The chart below shows the percentage of districts that mentioned a term last year (blue) versus this year (red):
3. Burbio's School Bond Tracker dataset features such elements as bond amount, coverage summary, vote date, approval status, document links, and more (available via both sortable dashboards and keyword searching). The largest bond voting periods occur in the Fall and the Spring, but many districts, in particular smaller ones, conduct bond votes over the Summer.
Here are some examples of bonds that passed and failed recently:
- Valley City Public Schools, ND, passed a $46 million bond that will result in a new school, to be connected to an existing elementary school, that will create a combined K-12 school building for the district.
- Cape Elizabeth Public Schools, ME, voters passed a $86.5 million bond that features a new middle school and an addition to an elementary school.
- Hastings on Hudson Union Free School District, NY, passed three bonds totaling $38.5 million featuring new classrooms and special education spaces, cafeteria upgrades, turf fields, and infrastructure improvements.
- Glenville-Emmons School District, MN, voters rejected a $24 million bond by 55%-45% that was focused on deferred maintenance such as roof replacements, HVAC system upgrades, asbestos removal, ADA improvements, and safety features.
- Romulus School District, MI, rejected a $153 million bond that covered technology, transportation, building infrastructure, athletic fields, playgrounds, and more.
4. Burbio's School Board Meeting Minute dataset contains everything from policy trends to highly specific, contextual answers about district initiatives through our Signals Tracker.
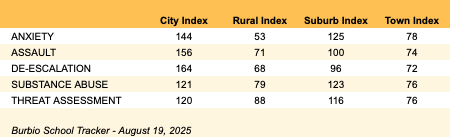
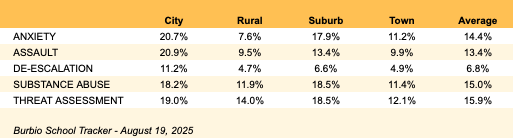
This week we continue our look at terms related to behavioral health, student conduct, and school safety, focusing on terms that are mentioned a bit less frequently. The following chart shows the percentage of school districts that mention the indicated terms at least once in the 12 months ending May. The analysis is broken down by district locale, and the final column shows the average of the four segments:
The next chart creates an index from the figures above, indicating the difference in frequency of mentions across locales: