PreK-12
Week of 12/13: 600+ Michigan Closures
School closures have slowed down since the November period, outside of a major spike in Michigan related to the shooting at Oxford High School which...
In this week's Tracker we cover teaching and non-teaching staffing levels at top districts, market penetration analysis from our checkbook registers, and summer school programming and staffing trends. More below.
1. As part of our foundational district information dataset Burbio delivers state and district-level enrollment and staffing data, sourced from Federal reporting and integrated into every layer of our district analysis and policy dashboards. This week we continue our review of recently released data from the National Center for Education Statistics (NCES) by looking at district staffing levels.
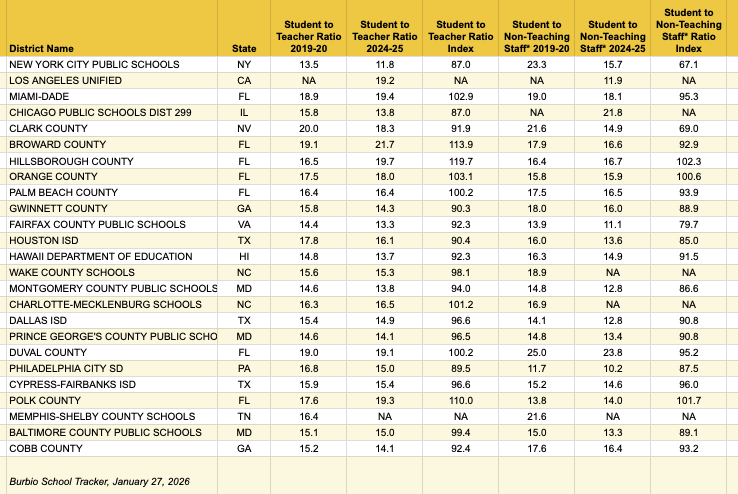
The charts below show the student/teacher staffing ratio in 2019-20 compared to 2024-25, and then the non-teacher student ratio with the same comparison. We start with the largest 25 districts in the country, and further below profile districts 26-50. A few notes on the chart:
The left-hand columns profile student-teacher ratios in each period and then presents an index comparing 2024-25 to 2019-20. To use NYC schools as an example, their student-teacher ratio dropped from 13.5 to 11.8 across 5 years, meaning they have more teachers per-student. The index divides the two ratios to provide the scope of the changes. An index less than 100 means they have more teachers per student in 2024-25 than 2019-20. The NYC index is 87. In several of the Florida districts, the index is just over 100, meaning they have more students per teacher in the recent period.
The same calculation occurs in the three far-right columns for all staff outside of teachers. Those figures cover everything from administrative staff to program coordinators to paraprofessionals. In NYC, the student-to-non-teaching staff ratio dropped, meaning there are more staff per student, and the index is 67. In the Florida districts the indexes are just above and below 100, meaning the staff to student ratio stayed relatively constant over the past five years.
California districts, and a handful of others nationally, did not report numbers during the period. We put an NA where that occurred.
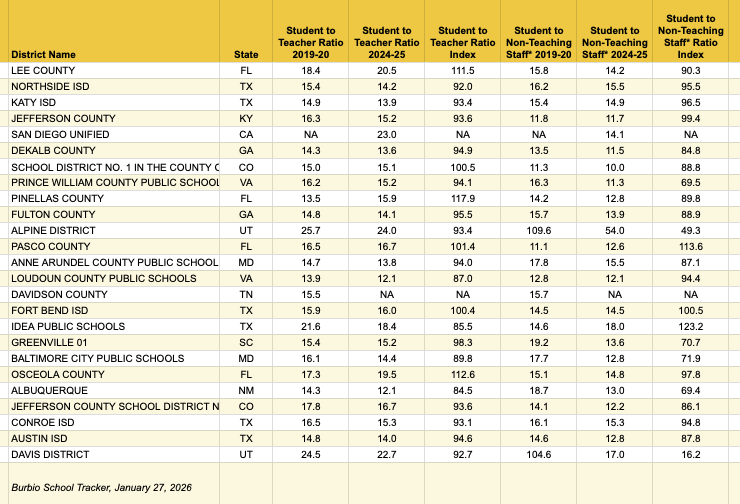
At the bottom of this email we feature districts 26-50 using the same methodology.
2. Burbio maintains a district checkbook register database covering districts with over 20 million students. With shifting post-Covid spending dynamics of the last year, we thought it would be interesting to examine district spending patterns. Below we present a chart showing the percentage of districts in our coverage area making at least one payment during the quarter to selected vendors in a category. For this analysis we made sure that the same districts were represented across the period to ensure a consistent comparison.
The chart covers six quarters. Given seasonal purchase patterns the best way to view the data is year-over-year, which entails comparing period ending 9/30/25 can be compared to 9/30/24 and the period ending 6/30/25 to a year earlier. We note that three of the categories have declined slightly while AI tools have been doubling:
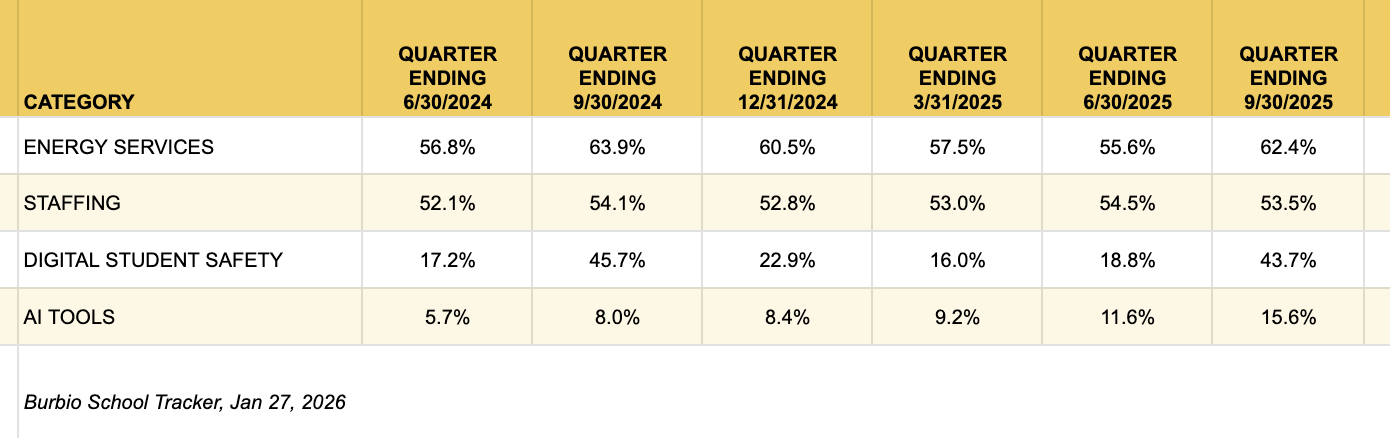
For the energy services (HVAC and energy) and digital student safety category above we picked the 11 largest providers in our database; for the staffing category it was the top 20. For AI tools we used ChatGPT, Magic School, Brisk and SchoolAI.
3. Burbio's Signals Tracker reads millions of pages of district discussions and summarizes them for clients who use the information to identify immediate selling opportunities. The signals can be pulled into CRMs via API and combined with client's proprietary AI models. This week we examined hundreds of recent district discussions for upcoming summer school programs. First, we note the most popular academic programs:
Literacy and math programs addressing learning loss, done through everything from six-week programs targeted to students in specific grades, to programs specially designed for targeted populations such as English learners
Credit recovery and secondary advancement programs
Expansion of STEM and CTE programs, frequently acting as enrichment programs
Special Education Programs designed for students with IEPs
Expanded learning programs partnering with outside organizations
During the review we were struck by the frequency of staffing discussions. Here are the trends:
Urgent recruitment and large-scale hiring across all functions
Compensation and Salary Alignment, such as increasing pay and/or aligning pay with regular year compensation
Specific discussion of filling leadership and specialized positions such as program directors, technology staff, and program coordinator roles
Logistics discussion driven by uncertainty around enrollment levels, which are often not finalized until much later in the year
Training and professional development needed to properly staff summer programs
4. We finish with a further review of teacher and staffing ratios. Below are districts 26-50 using the same methodology as described above:
School closures have slowed down since the November period, outside of a major spike in Michigan related to the shooting at Oxford High School which...
In this week's Tracker we cover Back to School opening dates for this Fall, trends in board meeting discussions, additional budget reviews, and the...
By the end of this week, just over ten percent of K-12 public school students will have started school. One of the major issues of the Fall is around...